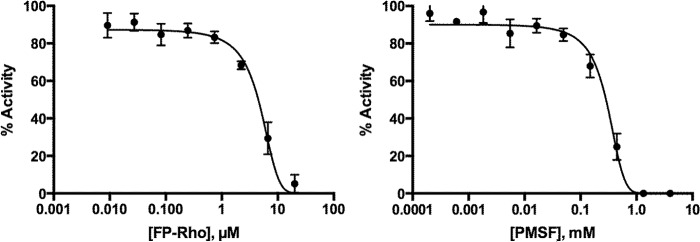
FIGURE 6.

IC50 curves of FP-Rho and PMSF. The IC50 curves were run in triplicate with 250 nm MarP_179–397 and 50 μm WKLL-AMC for 36 min at room temperature. Inhibitor concentrations were varied from 0 to 20 μm FP-Rho and 0–1200 μm PMSF in 3-fold dilutions. Activities were normalized to uninhibited. The calculated IC50 for FP-Rho and PMSF were 4.5 and 284 μm, respectively.
