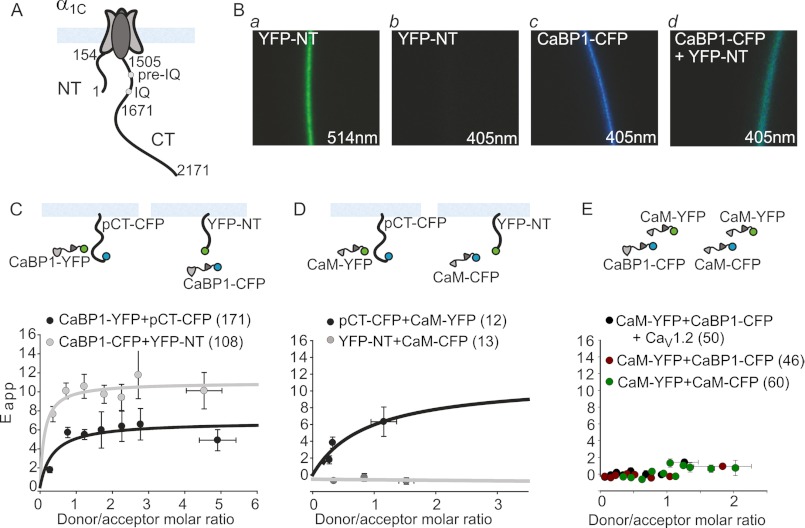
FIGURE 1.
Two-hybrid FRET reveals interactions of CaBP1 and CaM with the N or C termini of CaV1.2. A, shown is a schematic representing the Cav1.2 α1C subunit with the plasma membrane (blue) and the cytosolic termini: NT (amino acids 1–154) and CT (amino acids 1505–2171) with the pre-IQ and IQ motifs. Numbering refers to the rabbit α1C isoform. B, imaging of exogenously expressed fluorescent proteins in representative Xenopus oocytes is shown. Excitation wavelengths are indicated. Direct excitation of YFP with the 405-nm laser (b) produced an ∼4–5% emission reading compared with excitation with the 514-nm laser line (a). A change in emulated color from blue (CFP emission alone; c) to turquoise in cells expressing both YFP and CFP-labeled proteins and excited with the 405 nm laser (d) indicates the presence of FRET. C–E, shown are FRET measurements. The top panels illustrate the experimental paradigms. Circles represent the fluorophores, YFP in green and CFP in blue. The metric for FRET (Eapp) was obtained for each experimental condition, binned, and presented as the mean ± S.E. for each bin (see “Experimental Procedures”). FRET was measured between fluorescently labeled CaBP1 (C) or CaM (D) and the membrane-attached cytosolic termini segments YFP-NT (amino acids 1–154) and pCT-CFP (amino acids 1505–1671). In control experiments there was no FRET between CaM-CFP and CaM-YFP or between CaBP1-CFP and CaM-YFP in the presence and absence of the channel CaV1.2 (E). In all plots the number of cells (n) is indicated in the figure caption. The number of experiments (N) was as follows: C, N = 5; D, N = 1; E, CaM + CaBP1 N = 3, CaM + CaM N = 5.

