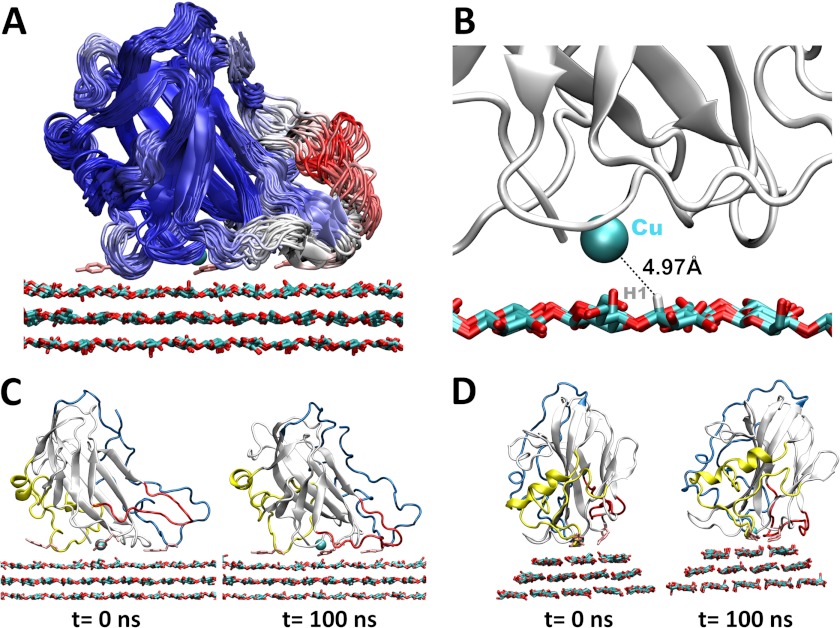
FIGURE 6.
Simulation results for PchGH61D on the hydrophobic surface of cellulose. A, cluster view of PchGH61D with snapshots taken every 5 ns, colored by RMSF from blue (low) to red (high). The tyrosine side chains (Tyr-28, Tyr-75, and Tyr-198) are shown in pink stick format in the conformation obtained after 100 ns. B, the copper (shown as a cyan sphere) fluctuates at ∼5 Å from the hydrogen atom on the C1 carbon during the MD simulation. C, side view of PchGH61D on the cellulose surface at t = 0 ns and t = 100 ns. The loops are colored as in Fig. 1. D, back view of PchGH61D on the cellulose surface at t = 0 ns and t = 100 ns.

