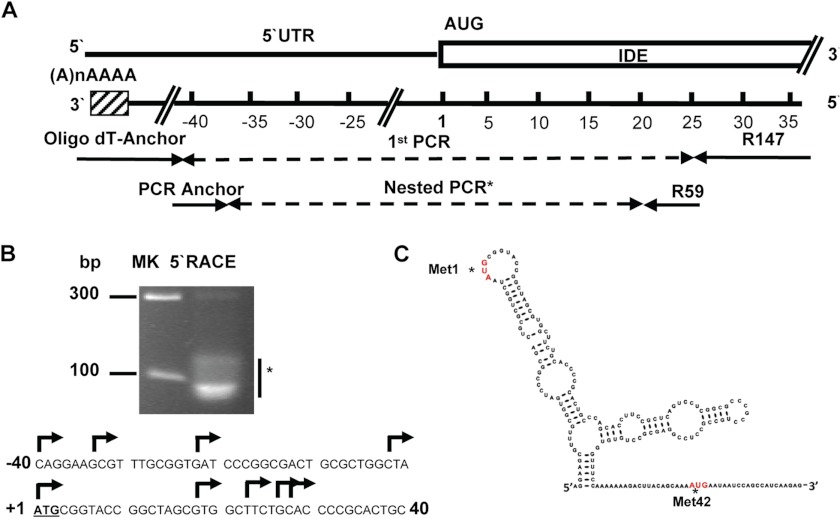
FIGURE 1.
Schematic representation of hIDE promoter region. A, primer positions used for the rapid amplification of cDNA 5′-end (5′RACE). B, upper panel, the asterisk indicates the heterogenic composition of the product obtained from the second PCR resolved in an 8.4% Tris borate-EDTA polyacrylamide gel. On the left are markers in bp. Lower panel, arrows indicate different transcription start sites identified in the −40/28 region of the hIDE promoter. The first putative translation start site (DNA) is underlined. C, prediction of RNA secondary structure (minimum free energy) of L-hIDE showing both putative translation start sites (asterisks). The bases are colored according to the calculated probability to be a single strand: red, probability greater than 0.75; orange, probability greater than 0.5 and lower than 0.75; and black, probability lower than 0.5.

