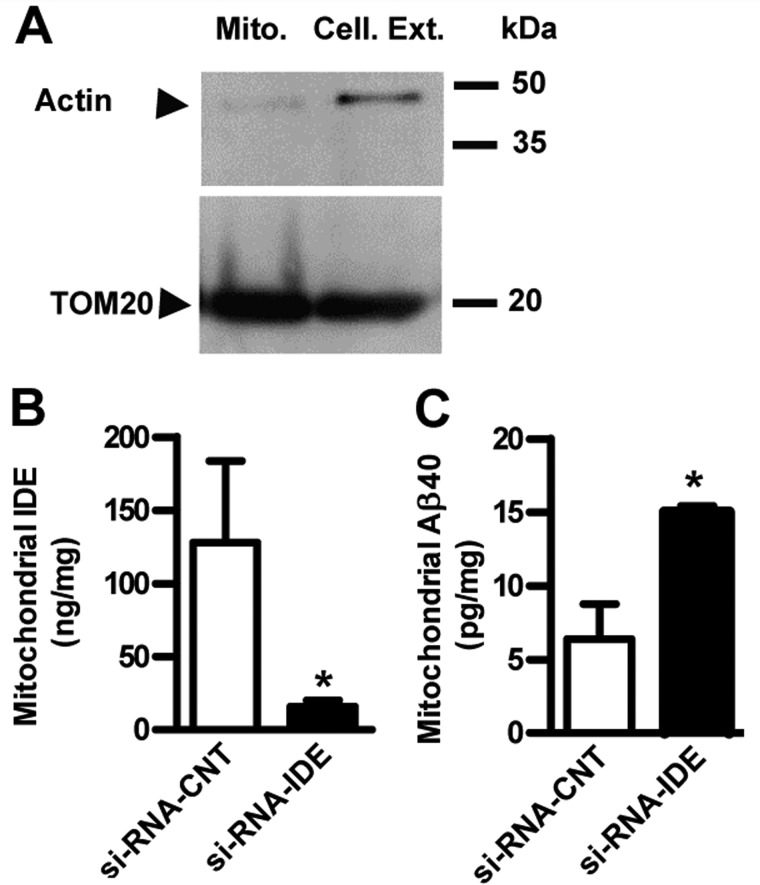
FIGURE 6.
Mitochondrial IDE expression impacts Aβ catabolism and mitochondrial functionality. A, representative Western blot showing the purity of mitochondria (Mito.) isolated from cellular extracts (Cell. Ext.) (8 μg/lane) of transfected HEKSw cells probed with anti-actin (38) (upper panel) and with anti-TOM20 (Santa Cruz Biotechnology) (lower panel) antibodies, respectively. Left, molecular mass markers in kDa. IDE (B) and Aβ40 (C) levels were determined by ELISA in mitochondria isolated from HEKSw cells transfected with control siRNA (si-RNA-CNT) or siRNA specific for IDE (si-RNA-IDE). Bars show the mean ± S.E. of mitochondrial IDE and Aβ40 amounts normalized by mg of total protein. *, p < 0.01, control siRNA versus IDE siRNA (n = 3). Error bars represent S.E.

