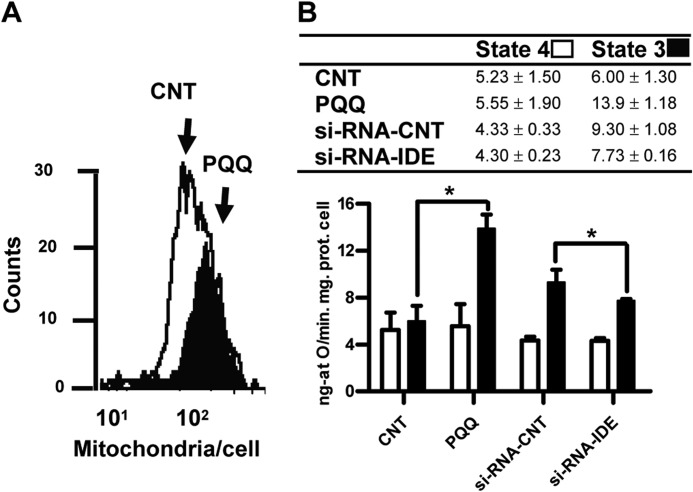
FIGURE 7.
L-IDE expression modulates the RCR in HEKSw cells. A, increment in cellular mitochondrial content after PQQ exposure detected after 10-N-nonyl acridine orange staining and flow cytometry assay. Representative histograms (cell counts at each fluorescence intensity, 101–102) for control (white) and PQQ (black) are shown. Significant differences were detected in fluorescence values between control and PQQ-treated cells (mean values in arbitrary units 28.74 ± 0.20 versus 30.31 ± 0.23; p < 0.001). B, mitochondrial respiration was determined by oxygen electrode measurement in HEKSw cells exposed or not to PQQ and treated with control siRNA (si-RNA-CNT) or IDE siRNA. *, p < 0.05, control (CNT) versus PQQ and control siRNA versus IDE siRNA. Inset, mean ± S.E. of state 4, state 3, and RCR (n = 5). Error bars represent S.E.

