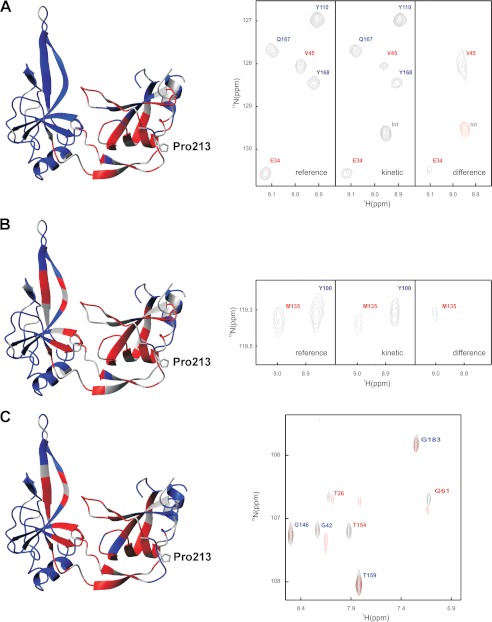
FIGURE 8.
Structural characteristics of the activated form of G3P with trans-Pro-213 determined by real-time NMR spectroscopy as described under “Experimental Procedures.” Residues with native-like cross-peaks in the 15N-TROSY-HSQC spectrum are depicted in blue. They identify amide NH in a native environment in the activated form of G3P. Residues that lack native-like cross-peaks are depicted in red. They identify amide NH that are not in a native-like environment. The side chain of Pro-213 is shown in stick representation. Gray residues could not be analyzed. A–C, the activated state of G3P was produced by a 30-min refolding pulse (A), by refolding in the presence of TolA-C (B), and by incubation of fully folded G3P with a 12-fold molar excess of TolA-C (C) as described under “Experimental Procedures.” Sections of reference, kinetic, and difference real-time NMR spectra are depicted on the right-hand side of panels A and B. The signals are labeled in red or blue as in the structure representation. Positive signals are shown in black, and negative signals are in red. The right side of panel C shows the superposition of the NMR spectra of G3P in the absence (black) and in the presence (red) of TolA-C.

