FIGURE 3.
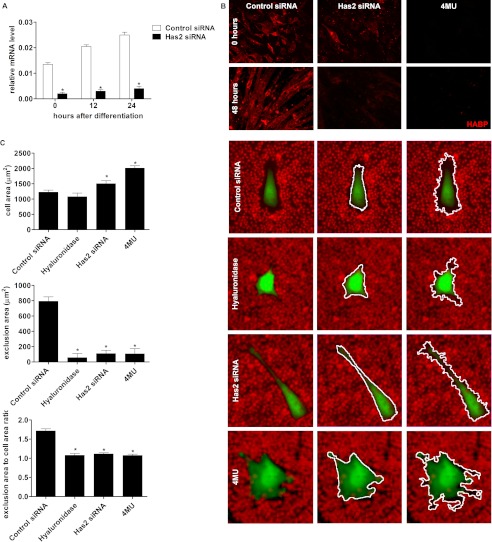
Knockdown of Has2 and reduction in levels of hyaluronan. A, relative mRNA levels of Has2 following C2C12 transfection of Has2 siRNA and induction of differentiation. An 89% reduction in Has2 mRNA compared with control was achieved at day 0, and similar magnitude reductions persisted for 24 h following the addition of differentiation medium. Statistical analysis was performed by the Relative Expression Software Tool. *, p < 0.05, n = 4. B, HABP reactivity in control and Has2 siRNA- and 4MU-treated C2C12 cells in nearly confluent undifferentiated cultures (0 h after the addition of differentiation medium) and 48 h after the addition of differentiation medium. Representative images of HABP immunofluorescence with Has2 siRNA and 4MU treatment demonstrated a decrease in hyaluronan content compared with control; in the vast majority of 4MU-treated cells, there was a near absence of HABP reactivity. C, representative images of the pericellular erythrocyte exclusion assay, demonstrating reduced area of the exclusion zone surrounding myoblasts with hyaluronidase, Has2 siRNA, and 4MU treatment compared with control. An increase in cell size and altered morphology with Has2 siRNA and 4MU is also evident. White outlines highlight the binary masks generated for the area measured of the cell (middle) and exclusion area (right). Quantitation of the areas measured for the cells and the exclusion areas alone and the ratio of the exclusion area plus cell size divided by the cell size are presented below. *, p < 0.05, n = 4. Error bars, S.E.

