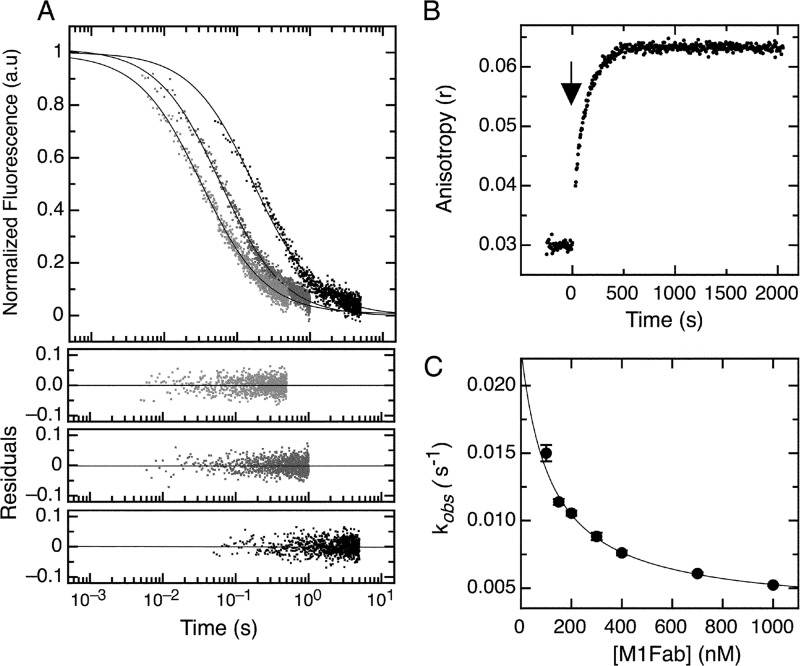
FIGURE 4.
Association kinetics of the E7Ep·M1Fab complex. A, bimolecular association phase. FITC fluorescence intensity change after mixing FITC-E7Ep and M1Fab at equimolar concentrations. Light gray, 430 nm; dark gray, 200 nm; black, 50 nm. The fits to a second-order association model for each trace were used to obtain the value of kon for each condition and are shown as full lines (see Equation 2). Residuals from the fits are shown below the graph (430 nm (top), 200 nm (middle), and 50 nm (bottom)). The value obtained by averaging all measurements was kon = 6.4 ± 1.8 × 10⁷ m−1 s−1. B, slow association phase. Change in FITC fluorescence intensity was measured after mixing 100 nm FITC-E7Ep with 600 nm M1Fab. The addition of M1Fab antibody (black arrow) was established as time 0. Traces were fit to a single exponential function to obtain the observed rate constants at each concentration (supplemental Fig. S3). C, concentration dependence of the slow association phase. The observed rate constants were measured at 50 nm E7Ep and increasing M1Fab concentrations. The data were fitted to a pre-equilibrium model by using Equation 4.

