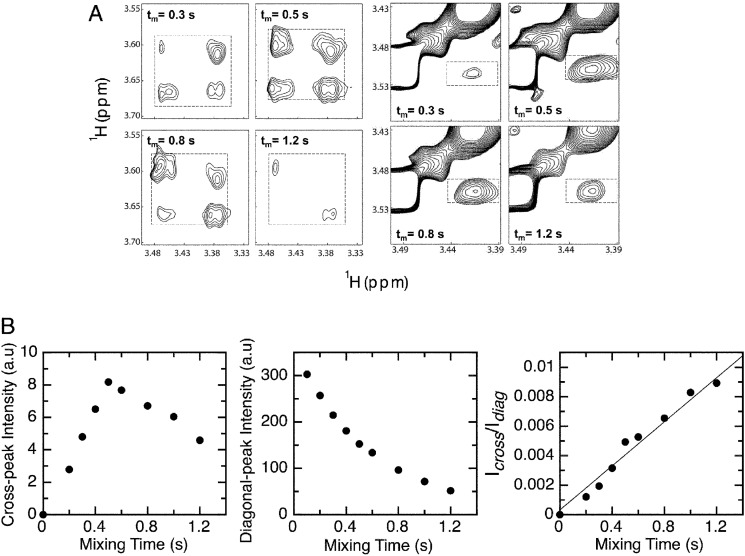
FIGURE 7.
Prolyl cis-trans isomerization kinetics estimated by NMR. A, selected region of the NOESY spectra at 30 °C recorded with different mixing times (τm) illustrating the variation of the chemical exchange cross-peak intensities for Hδ of Pro-47 (left panels) and Pro-41 (right panels). The exchange cross-peaks are boxed. B, examples of chemical exchange cross-peak intensity (left) and of diagonal cross-peak intensity (middle) as a function of mixing time. The right panel shows an example of the cross-peak to diagonal peak intensity ratio. The data were fit to Equation 9 to estimate the kinetic rates for proline isomerization (see “Experimental Procedures”).

