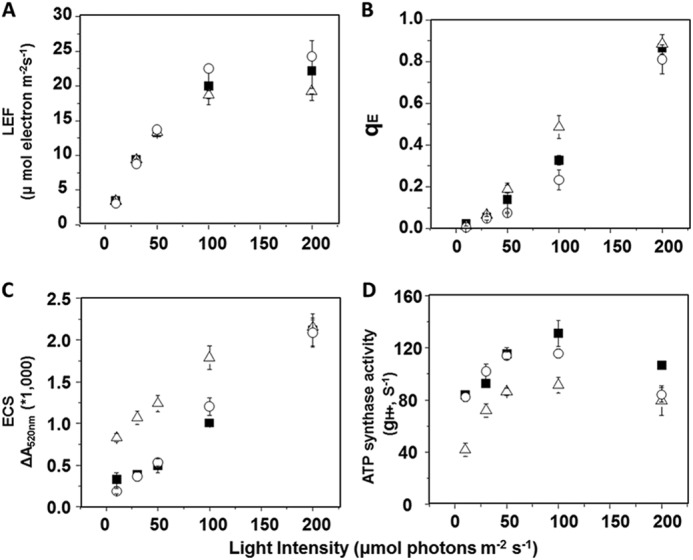
FIGURE 2.

Wild type (filled squares), a representative complemented line (35S::ATPC1 expressed in dpa1) (open circles), and mothra (open triangles) were compared for differences in light intensity-dependence of LEF (A), qE (B), light-induced pmf estimated by analysis of the electrochromic shift (ECSt) (C), and gH+ (D), based on first exponential ECS decay kinetics. Data are for attached leaves (n = 3).
