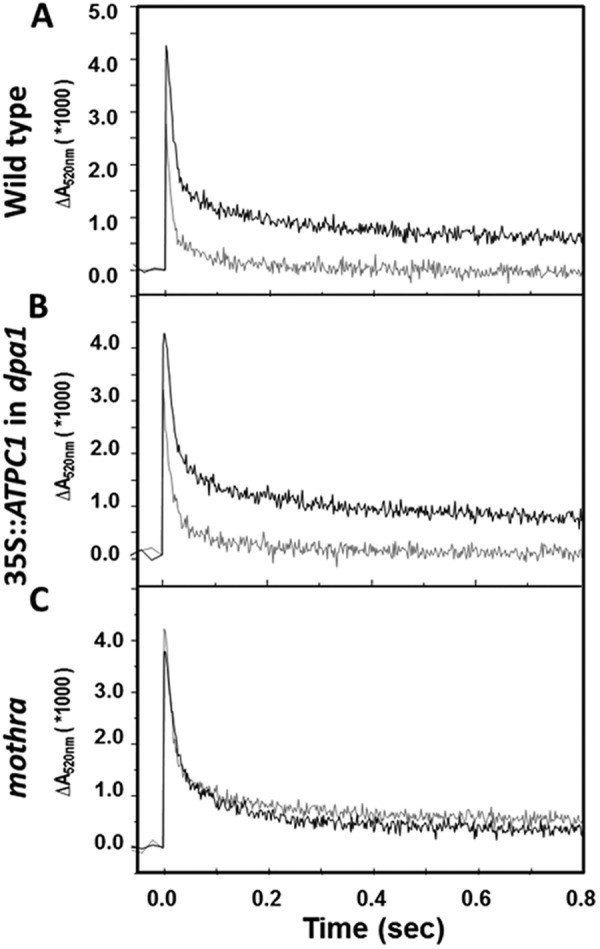
FIGURE 3.

Activity of the ATP synthase probed by the decay of the ECS signal. Flash-induced relaxation kinetics of ECS (15, 33) were measured for wild-type (A), complemented line (35S:: ATPC1 expressed in dpa1) (B), and mothra (C) at 1 min (gray curves) and 60 min (black curves) after 2-min preillumination at 100 μmol photons m−2 s−1 actinic light.
