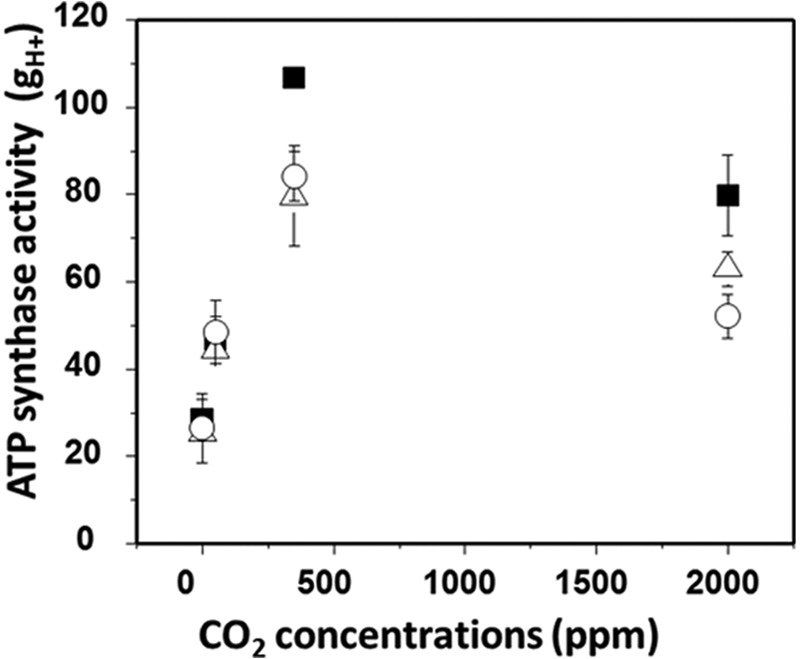
FIGURE 6.

Change in ATP synthase activity (gH+) from steady-state photosynthetic parameters in wild-type (filled squares), complemented line (35S::ATPC1 expressed in dpa1) (open circles), and mothra (open triangles) under 0, 50, 350, and 2000 ppm CO2 under 200 μmol photons m−2 s−1. Data are for attached leaves (n = 3–4).
