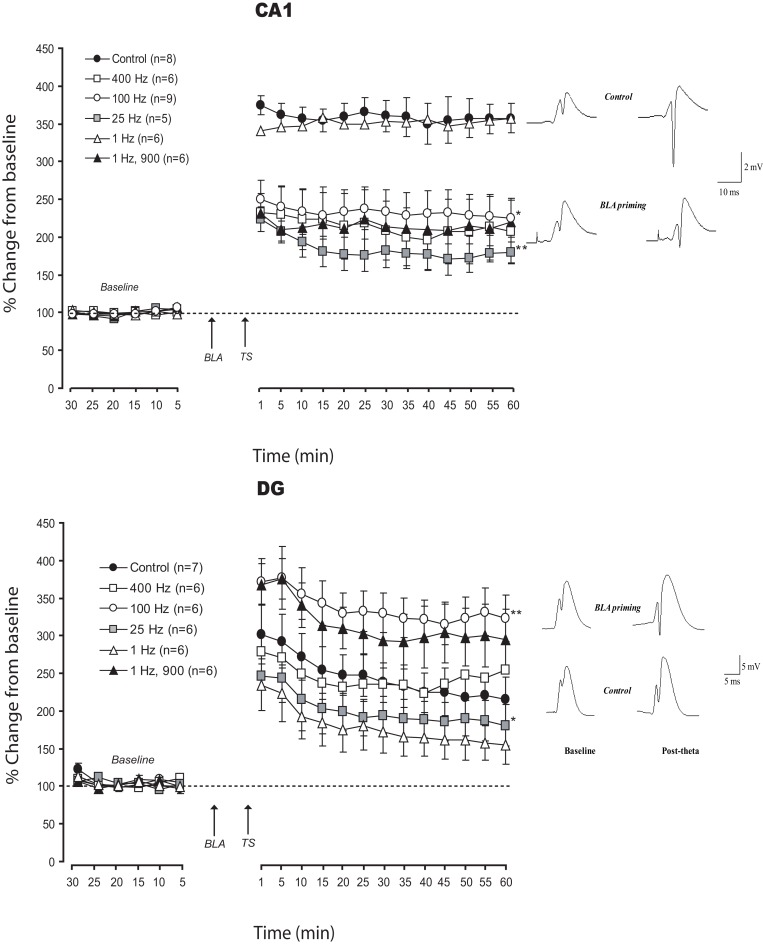
Figure 2.
Effects of frequency modulation of BLA activation on LTP in CA1 and DG: Mean (±SEM) percentage of baseline. The majority of patterns of BLA activation used here impaired LTP in CA1. In DG, the different patterns induced changes varying from enhancement to strong impairment. The pattern less favorable for DG (1 Hz) was the only one which did not interfere with CA1 plasticity. Only one pattern (25 Hz) induced similar deficit in DG and CA1 LTP. Post-hoc Fischer test: *p < 0.05 and **p < 0.001 significantly different from control groups.

