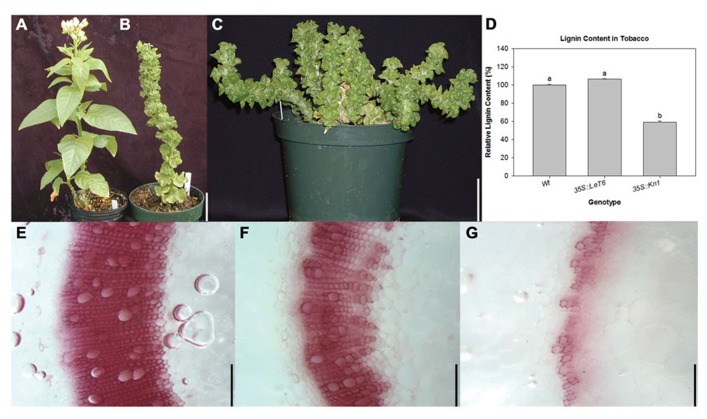
FIGURE 2.
Comparison of (A) wild-type (Wt), (B)35S:LeT6, and (C)35S:Kn1 tobacco plants. (D) Relative lignin content in Wt and transgenic 35S::LeT6 and 35S::Kn1 tobacco plants. Error bars represent standard error (± SE; N = 4) where P < 0.001. Phloroglucinol stained cross sections of (E) Wt, (F) 35S::LeT6, and (G) 35S:Kn1 tobacco stems. Scale bars = 5 cm (A–C); 0.1 mm (E–G).

