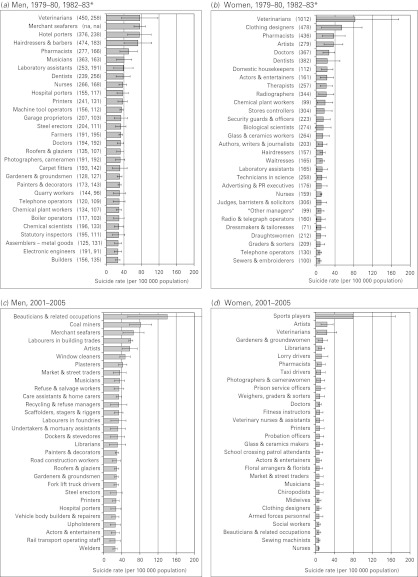
Fig. 2.
Suicide rates for the 30 occupations with the highest suicide rates in (a) men, 1979–1980, 1982–1983, (b) women, 1979–1980, 1982–1983, (c) men, 2001–2005, and (d) women, 2001–2005. Values in parentheses are standardized mortality ratios (SMRs) and proportional mortality ratios (PMRs) for men and PMRs for women. Horizontal bars represent 95% confidence intervals. This figure includes only those occupations with at least 10 suicides among men, and three among women, in either time period, 1979–1980 and 1982–1983 or 2001–2005 (suicide rates were about three times higher among men than among women). n.a., Not available.

