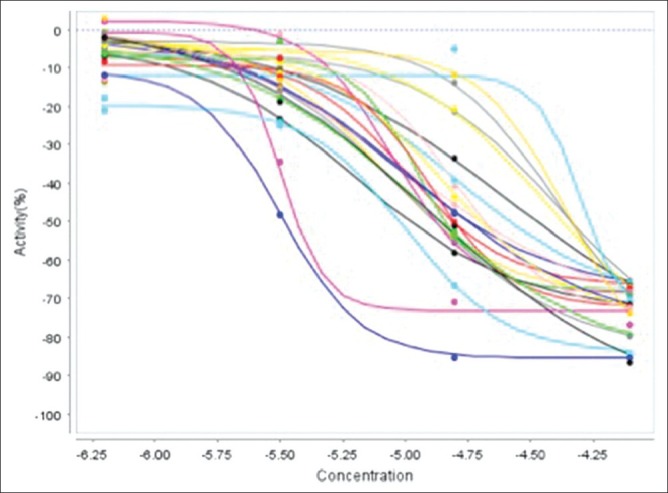
Figure 7.

Concentration effect curves from the quantitative high-throughput screening run of a group of top-active compounds clustered on chemotype. Despite showing greater than 10-fold differences in potency, note compounds in this cluster inhibited greater than 60%, suggesting that further attention be devoted to this chemotype
