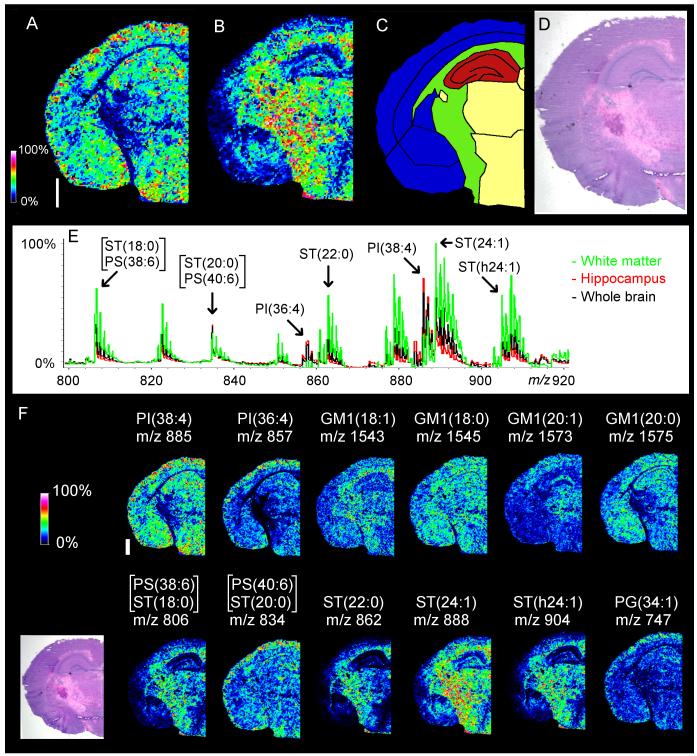
Fig 1.
MALDI-MSI images and regional spectra of adult mouse brain. “Heat map” MALDI-MSI images of PI(38:4) (m/z 885.5, panel A) and ST(24:1) with a d18:1 sphingosine (m/z 888.5, panel B) display localization to different regions of the brain. The white bar is 1000 microns and the scale displays relative intensities with respect to the abundance of each ion. These lipids correlate to specific brain structures (C) upon comparison with a serial H&E section (D). Comparison of the averaged MALDI-MSI spectrum from the entire tissue slice (E-black trace) with that of the hippocampus (E - red trace) and white matter (E - green trace) shows that many other d18:1 sulfatide species including ST(24:1) are more abundant in the white matter than the hippocampus, while the opposite is the case with several PI species including PI(38:4). Various lipids from several classes were also detected (F). Several species of ganglioside GM1 with d18:1 sphingosines exhibited different localization, depending on the composition of their long chain base. MALDI-MSI images were acquired in negative mode with an Ultraflex II.

