Fig. 3.
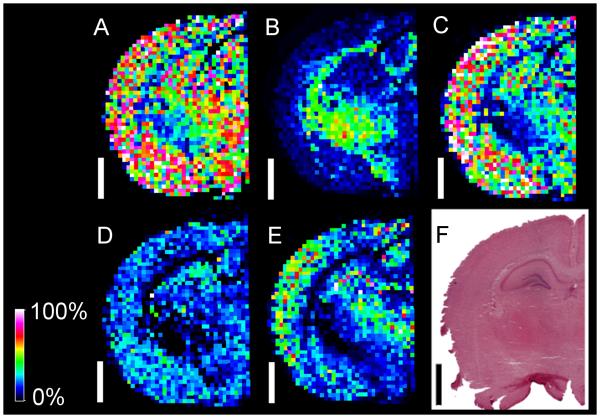
MALDI-MSI of cardiolipin (CL) and other more abundant phosopholipids after on-tissue phospholipase C (PLC) treatment. The white bar is 2mm and the scale displays relative intensities with respect to the abundance of each ion. A: PI(38:4) m/z 885.5, B: ST(24:1) m/z 888.5, C: GM1(d18:1/18:0)m/z 1544.8; D: CL(72:8) m/z 1447.9, E: CL(74:7) m/z 1477.9, F: near-serial H&E section. MSI images were acquired with an Autoflex in negative mode.

