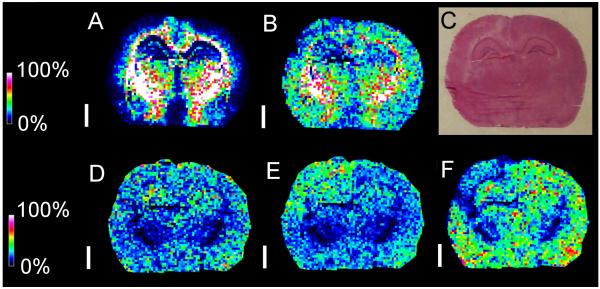
Fig. 9.
MALDI-MSI of pnd 17 rat brain after trauma. MALDI-MSI in negative mode shows different distributions of m/z 806.5 that contains nonoxidizable ST(d18:1/18:0) (A) and m/z 834.5 that containsoxidizable PS(18:0/22:6) (B) in brain after controlled cortical impact. Region of damage is shown by an arrow on serial H&E (C). The white bar is 200 microns and the scale displays relative intensities with respect to the abundance of each ion. While m/z 806.5 was detected in similar abundances between the hemispheres ipsilateral and contralateral to the point of impact, m/z 834.5 is somewhat reduced in the ipsilateral cortical and hippocampal regions with respect to the contralateral regions. MALDI-MSI in positive mode detected different abundances of PC(16:0/16:0) adducts between both hemispheres. While the [M+H]+ ion at m/z 734.5 (D) was detected in similar abundance ipsilateral and contralateral, the [M+Na]+ adduct ion at m/z 756.5 (E) was in greater abundance ipislateral while the [M+K]+ adduct ion at m/z 772.5 (F) was in greater abundance contralateral. Negative mode and positive mode MSI images were acquired with an Autoflex.

