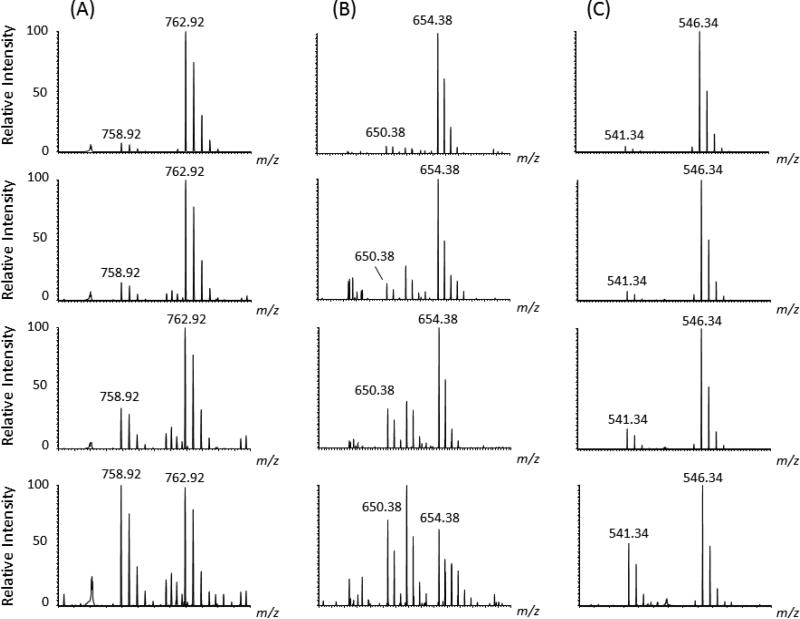
Figure 2. Representative mass spectra of spiked-in labeled standard peptides and corresponding unlabeled endogenous peptide using post-digestion spike-in approach.
(A) Mass spectra of labeled and unlabeled peptide pairs detected after spiking in-gel digested dystrophin with varying amounts of 13C6, 15N2 Lysine labeled standard peptide [IFLTEQPLEGLEK]. (B) Shows mass spectra of labeled and unlabeled peptide pairs detected after spiking in-gel digested dystrophin with varying amounts of 13C6, 15N2 Lysine labeled standard peptide [LLDLLEGLTGQK], (C) Shows mass spectra of labeled and unlabeled peptide pairs detected after spiking in-gel digested dystrophin with varying amounts of 13C6, 15N4 Lysine labeled standard [LLVEELPLR]. The concentration of each spike-in standard peptide, starting for the top to the low panels, was as follows (160 nM, 80 nM, 40 nM and 14 nM). Samples were analyzed on the LTQ-Orbitrap XL at 30,000 resolution and mass error better than 10 ppm. All ions were detected as doubly protonated species with the correct m/z values.

