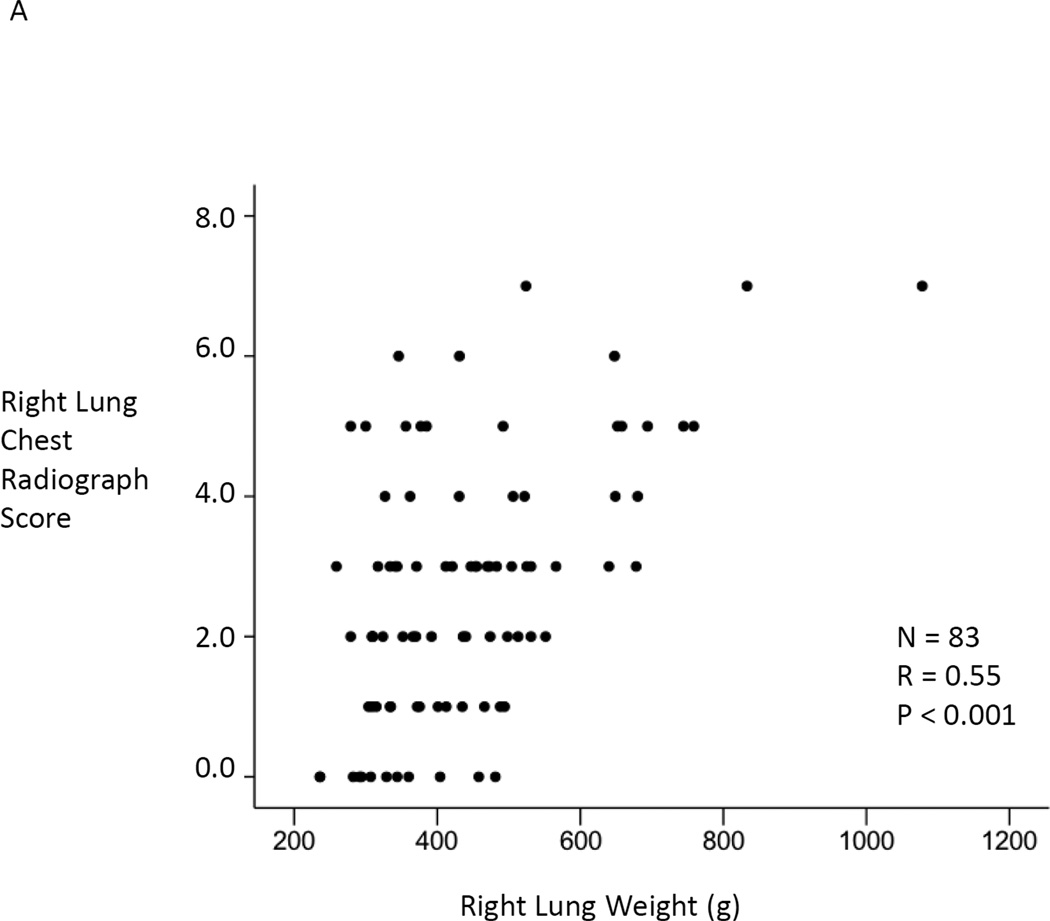
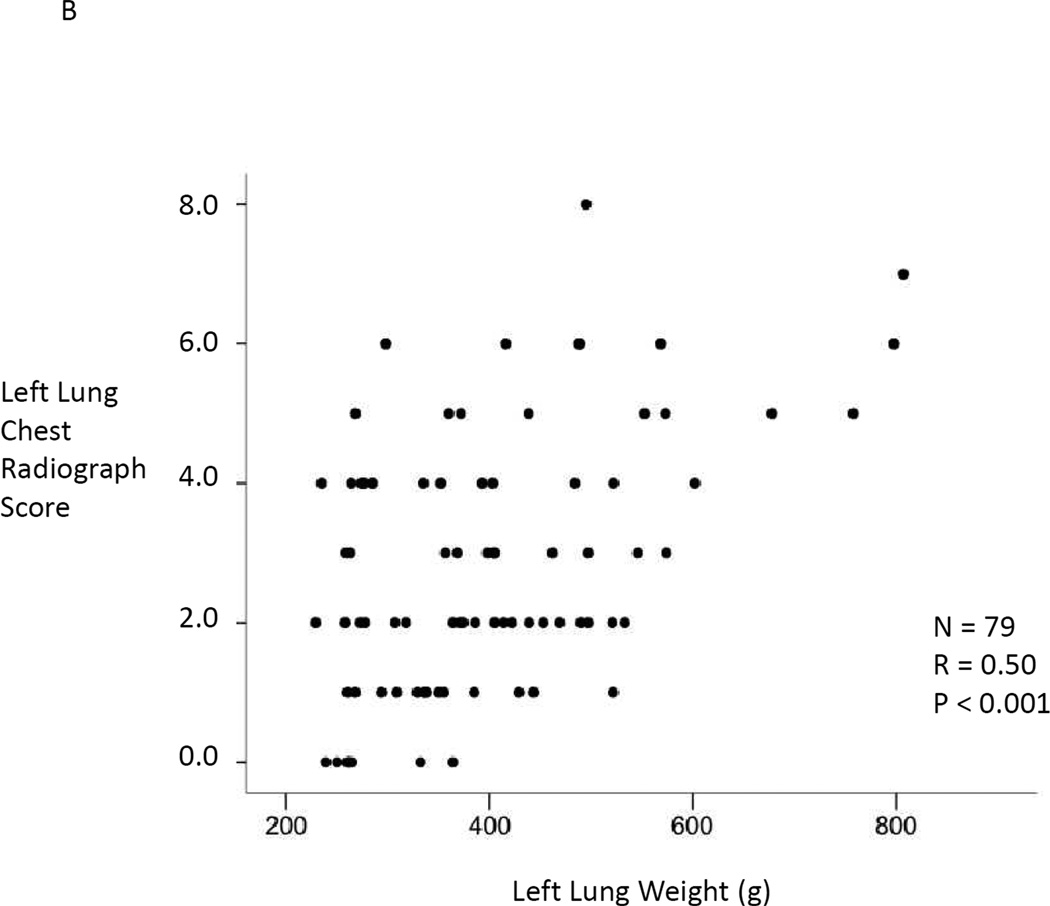
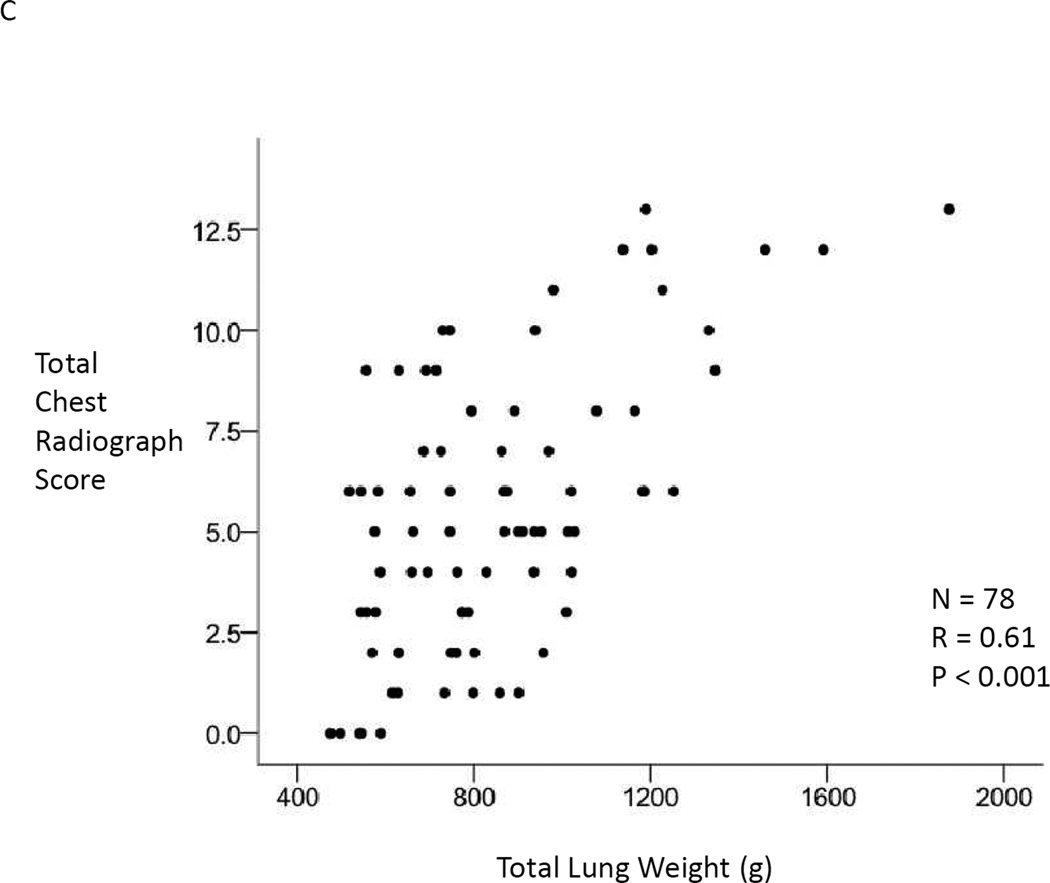
Figure 1.
Panel A, comparison of total right lung chest radiographic score to right lung weight. N = 83. Pearson’s correlation coefficient r = 0.55, p < 0.001. Panel B, comparison of total left lung chest radiographic score to left lung weight. N = 79. Pearson’s correlation coefficient r = 0.50, p < 0.001. Panel C, comparison of total right and left lung chest radiographic score to total right and left lung weight. Only donors who had both lungs resected for weight were included, N = 78. Pearson’s correlation coefficient r = 0.61, p < 0.001.


