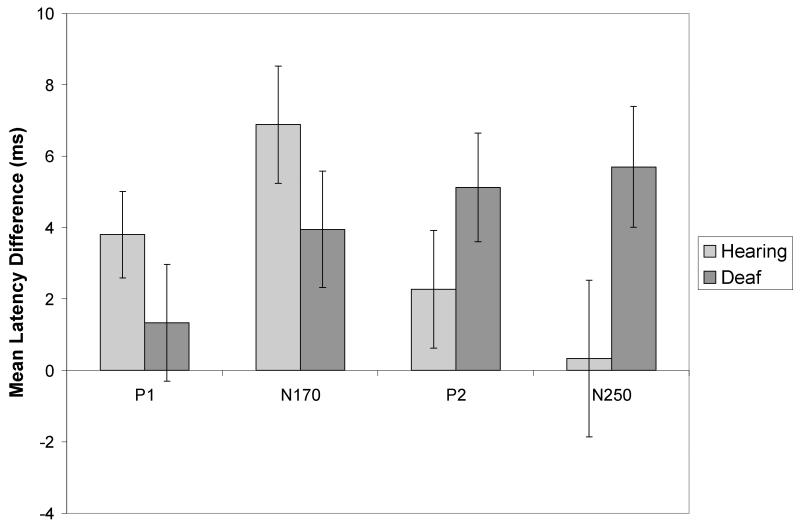
Figure 5.
Attended half effects in ERP components indicate processing advantages for the top half of the face at different perceptual stages in hearing and deaf groups. The mean latency differences shown are subtractions of the mean latency for the attend top conditions from the mean latency for the attend bottom conditions, such that positive values reflect a top half bias. Error bars are standard error of the mean.

