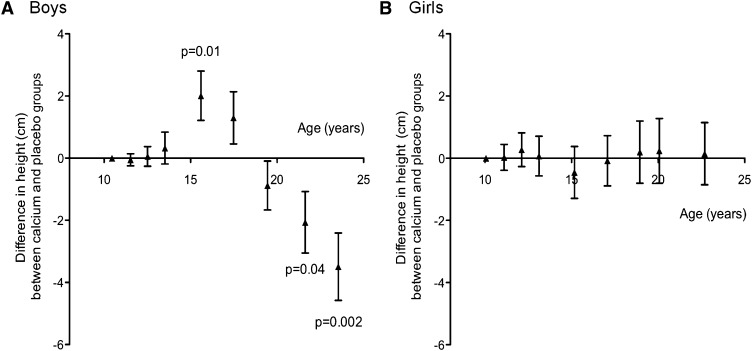
FIGURE 2.
Mean (±SEM) differences in height in boys (A) and girls (B) between the calcium and placebo groups by age at each measurement time point. The numbers of boys in the calcium and placebo groups, respectively, were as follows: 40 and 40 at Y1–6, 39 and 39 at Y8, 37 and 39 at Y10, 34 and 30 at Y12, and 29 and 25 at Y14. The numbers of girls in the calcium and placebo groups, respectively, were as follows: 40 and 40 at Y1–4, 38 and 39 at Y6, 39 and 40 at Y8, 29 and 25 at Y10, 33 and 30 at Y12/11, and 25 and 29 at Y14/13. The data are the differences between supplement groups at each time point, obtained as the group coefficient (calcium = 1, placebo = 0) from regression models adjusted for height and age at baseline. Significant differences are shown; all other differences were not significant (P > 0.1). Y, year of measurement relative to baseline (Y1).

