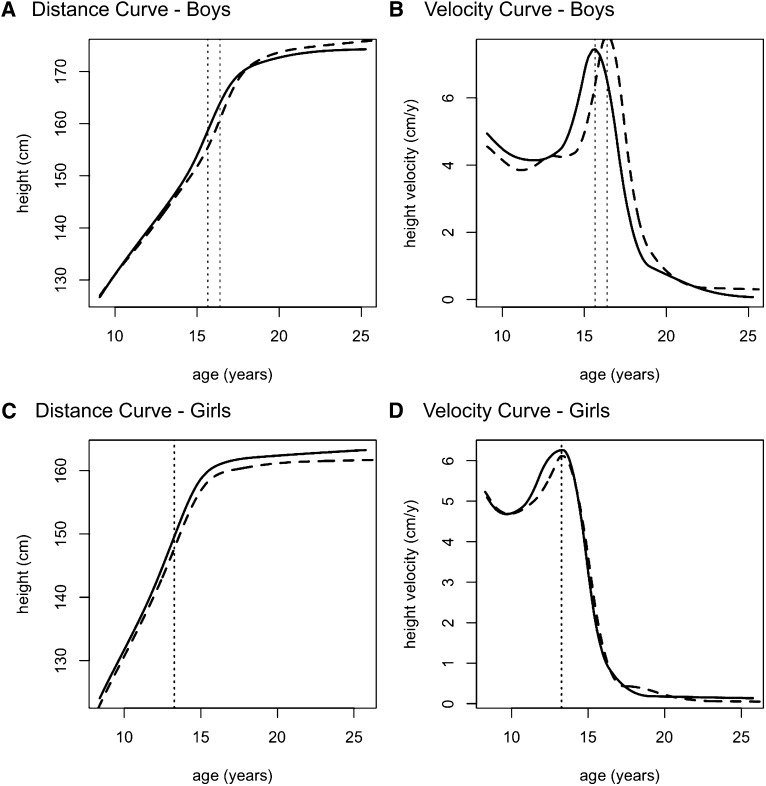
FIGURE 3.
SITAR (14) plots of height compared with age in the calcium group (solid lines) and the placebo group (dashed curves). The diagrams illustrate the distance curve for boys (A), the velocity curve for boys (B), the distance curve for girls (C), and the velocity curve for girls (D) in each group. Vertical dotted lines denote age at peak height velocity in each sex-supplement group. n = 40 boys and 40 girls in each supplement group in the longitudinal study. The total numbers of data points in the SITAR models were as follows: 670 for the boys and 755 for the girls. SITAR, Superimposition by Translation and Rotation Method.

