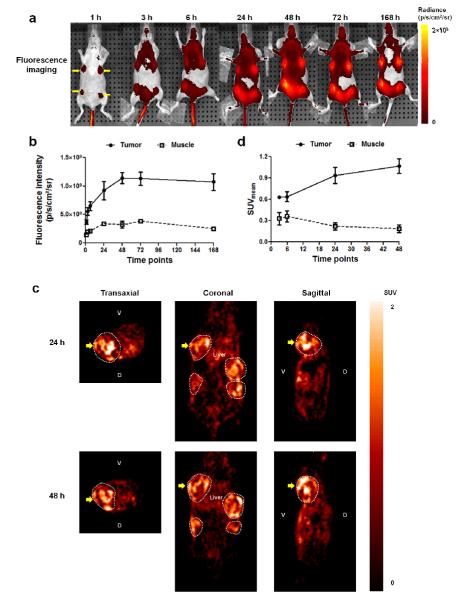
Fig. 3.
In vivo dual-modality fluorescence/PET imaging. a) Representative fluorescence imaging of mice at various time points (1, 3, 6, 24, 48, 72 and 168 h pi) post probe 4a (10 nmol per 20 g mice) injection (iv). Four tumor sites are indicated with yellow arrows. b) Fluorescence intensities of tumor and muscle were plotted against post injection time (1 h up to 168 h pi) (n=4, nt=16). c) Representative PET images of tumor-bearing mice ip administered with probe 4b. Images are presented in three directions (transaxial, coronal and sagittal) at 24 and 48 h pi. Tumor regions are surrounded by white dotted circles. The tumor-of-interest in all images is indicated with bold yellow arrows. d) Mean SUV values of tumor and muscle at various time points (3, 6, 24 and 48 h pi).

