Fig. 5.
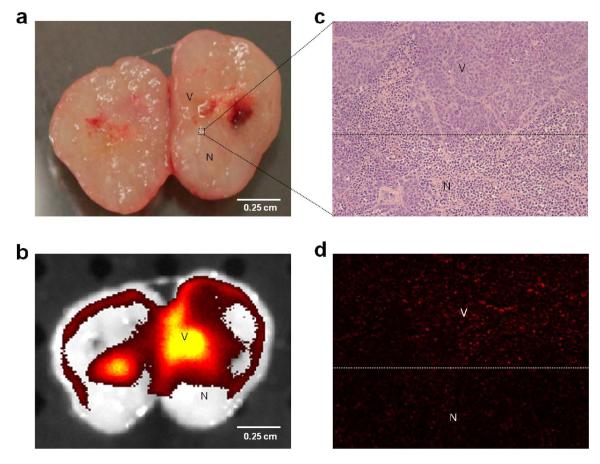
Probe distribution in tumor tissue at the microscopic level. a) Representative picture of freshly harvested tumor sectioned in half. Pink area could be observed as viable region (V) while necrotic (N) area was recognized as white or off-white color due to absence of blood supply. b) Fluorescence image (by IVIS spectrum) of the same tumor segment suggested that fluorescence signal (yellow) was mainly associated with viable regions. c) and d) demonstrated microscopic images of tumor area indicated by dotted line square (×100 fold magnification), which were also a zoomed-in version of panel a and b. While hemotoxylin/eosin staining (c) clearly exhibited the boarder of the viable and necrotic regions that were recognized by cell morphology, fluorescence microscopic image (d) revealed that the majority of fluorescence signal was associated with viable regions.

