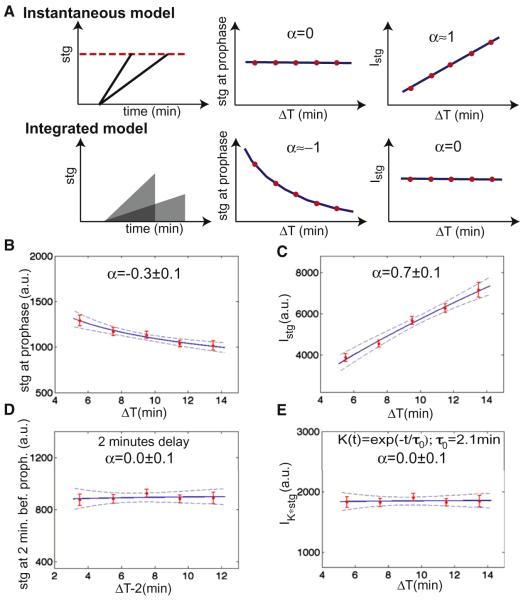
Figure 4. Two Models for the Control of Entry into Mitosis.
(A) Correlation analysis to distinguish between an instantaneous and an integrated model for cell cycle control. Data were fitted with the function AΔTα (predicted value of α are reported; dashed lines are 95% confidence intervals on the fit).
(B) Concentration of Cdc25string at the time of chromosome condensation as a function of ΔT.
(C) Integral of the concentration of Cdc25string as a function of ΔT.
(D) Concentration of Cdc25string 2 min before chromosome condensation as a function of ΔT.
(E) Convolution between the concentration of Cdc25string and an exponential kernel K(t) as a function of ΔT , where t = 0 is the beginning of Cdc25string accumulation. Error bars are standard error of the mean. See also Figure S3.

