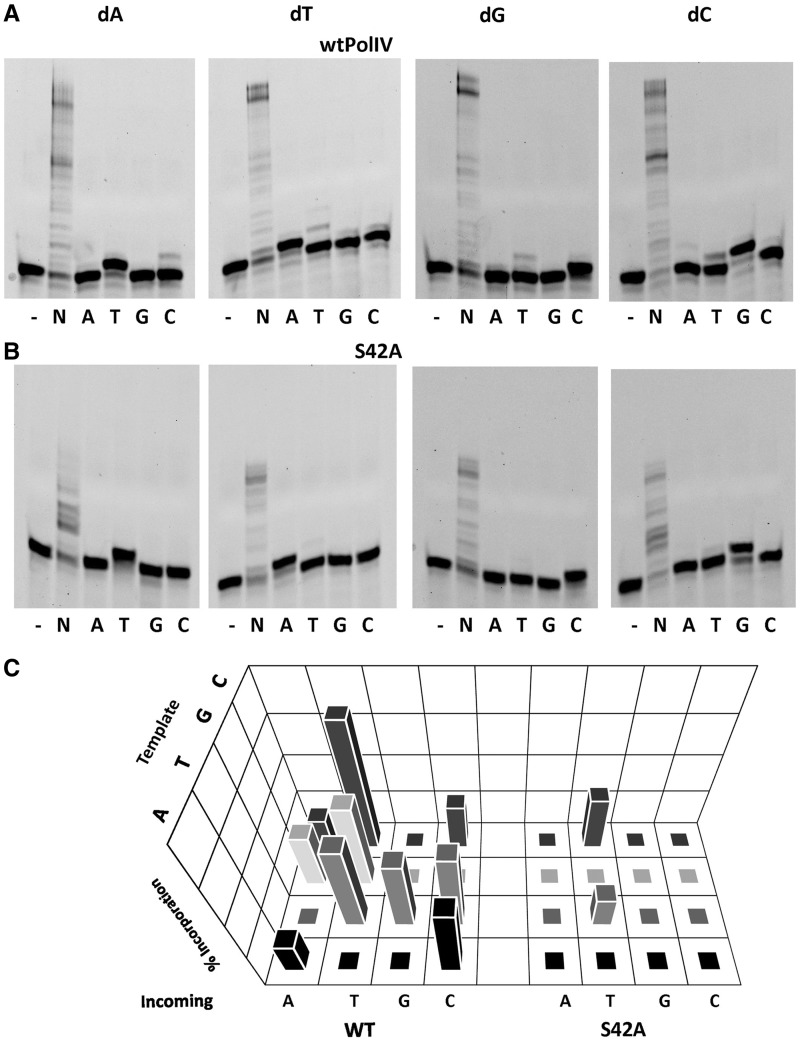
Figure 3.
Fidelity profile of wt PolIV and the mutant Ser42Ala. The results for primer extension assay wherein wtPolIV (A) or the Ser42Ala mutant (B) was incubated with DNA duplexes (TAP*, TTP*, TGP* and TCP*) and different dNTPs are displayed. (B) 3D plot exhibiting the misincorporation profile of wtPolIV and the mutant. Incorporation was quantitated in the form of percentage of primer extended. The level of incorporation of the incorrect nucleotide is plotted on the z-axis for different template nucleotides (dA, dT, dG and dC; y-axis), for all four incoming nucleotides (dATP, dTTP, dGTP and dCTP; x-axis) for the two proteins (wtPolIV and Ser42Ala; x-axis).

