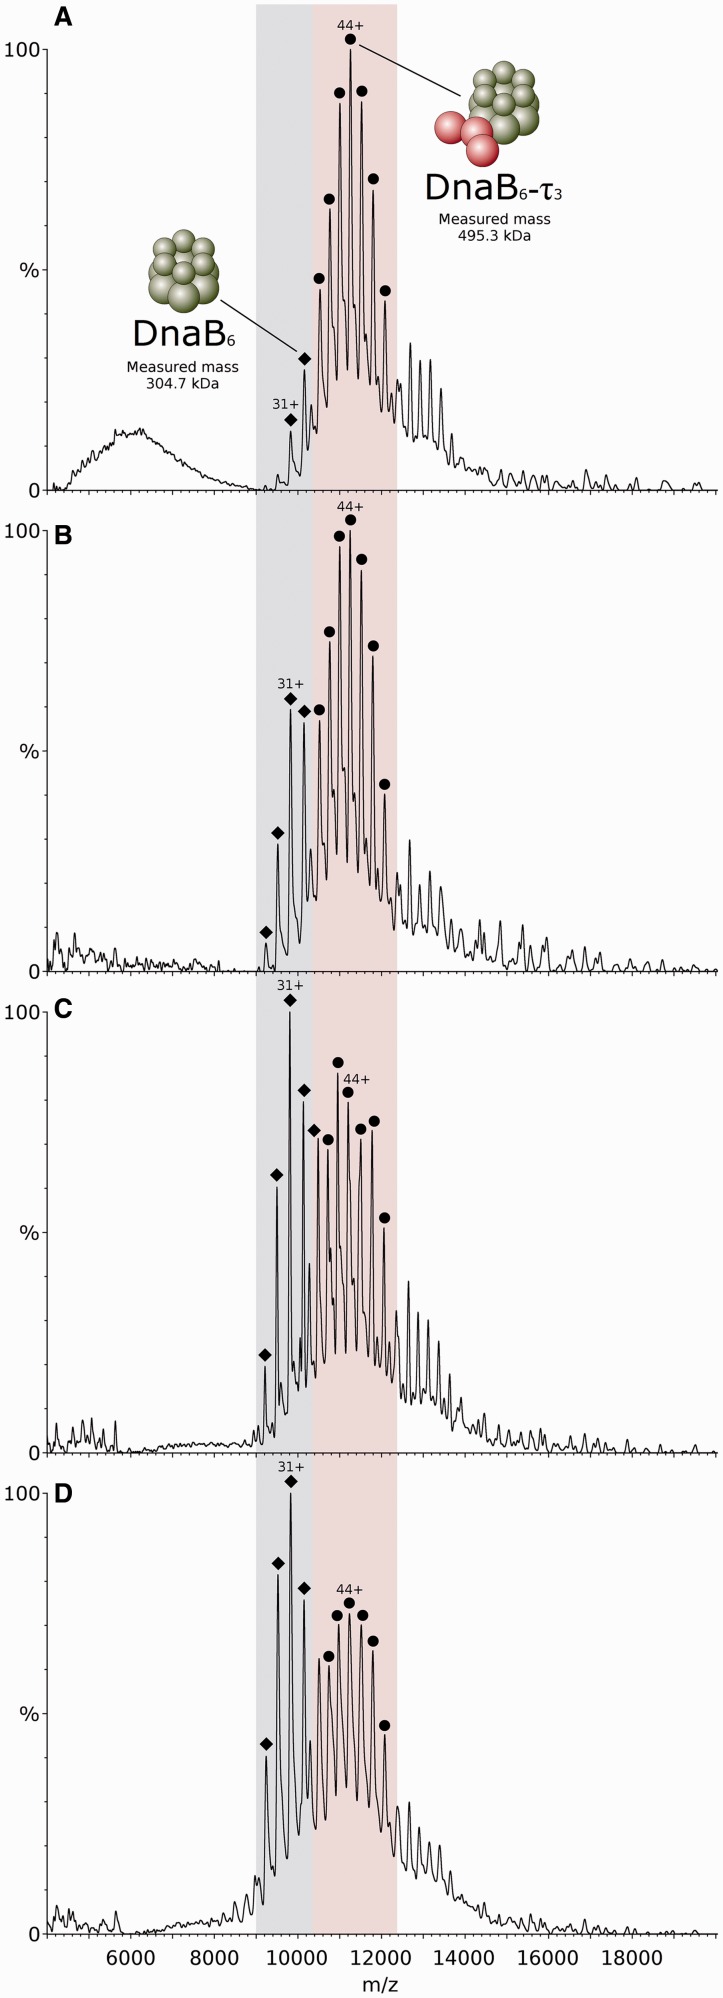
Figure 4.
Mass spectra of the B. subtilis τ3 subunit interaction with the B. stearothermophilus DnaB helicase. Proteins were mixed in a τ3-DnaB6 stoichiometry and sprayed from different buffer compositions. Signal for the τ3-DnaB6 complex is located in the pink region of the spectra, while unbound DnaB6 is located in the blue region. (A) Proteins sprayed from 1 M ammonium acetate containing 0.5 mM Mg2+ and 0.1 mM ATP. The τ subunit is represented by red spheres, while the DnaB hexameric ring is represented in green. (B) Proteins sprayed from 1 M ammonium acetate containing 0.1 mM ATP. (C) Proteins sprayed from 1 M ammonium acetate containing 0.5 mM Mg2+. (D) Proteins sprayed from 1 M ammonium acetate only.

