Figure 3.
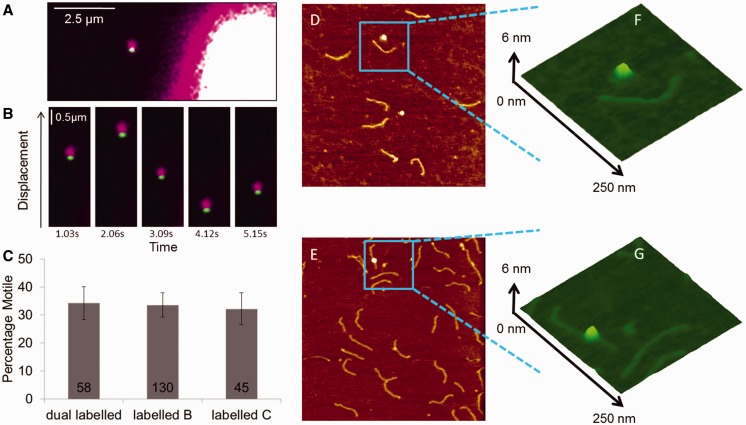
UvrBC binding to DNA. (A) Imaging of dual color Qdot-labeled UvrBC shows the presence of both UvrB (green Qdot) and UvrC (purple Qdot) on DNA tightropes (unlabeled). The bright object on the lower right is the corner of a silica pedestal bead. (B) UvrBC diffusion is shown as movement on an unlabeled DNA tightrope over successive frames temporally separated by 1.03 s. (C) The percentage of motile complexes are shown to be unaffected by labeling strategy. Mean (±SE) values were plotted: 34.3% (±5.9, n = 58 molecules), 33.6% (±4.3, n = 130 molecules) and 32.2% (±5.8, n = 45 molecules) for dual labeled, labeled B or labeled C, respectively. AFM images of 458-bp dsDNA incubated with UvrB–Qdot conjugates (D) in the absence and (E) presence of in vivo biotinylated UvrC-avi. The image size is at 1 × 1 µm, and the Z scale is at 2 nm. (F) and (G) are zoomed 3D displays of the marked areas in (D) and (E).

