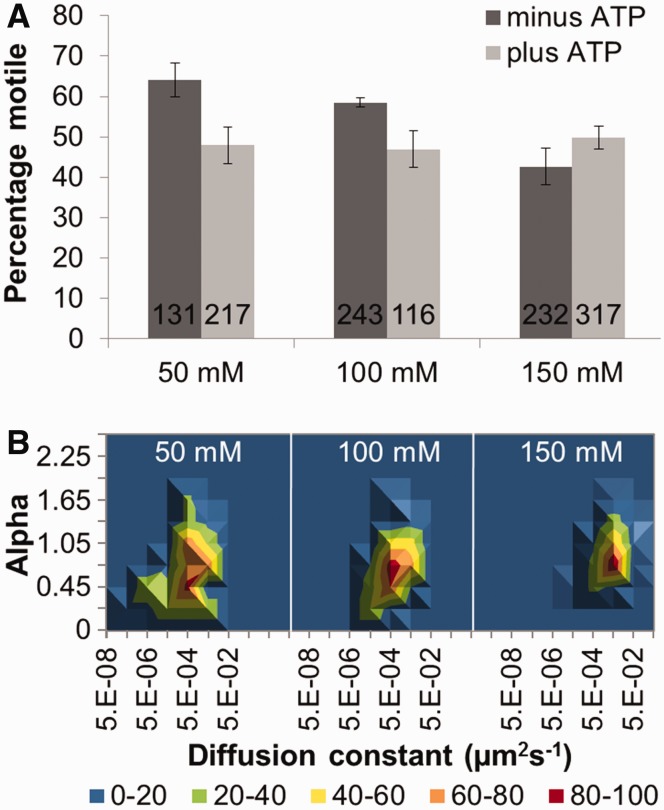
Figure 4.
The motile characteristics of UvrBC. (A) Mean percentage (±SE, where n refers to experiments repeated on different days) of moving UvrBC in the presence of ATP (light gray bars). Values were 47.9% (±4.8, n = 7), 46.9% (±4.5, n = 5), 49.9% (±2.9, n = 5) at 50, 100 and 150 mM KCl, respectively. In the absence of ATP (dark gray bars), values were 64.1% (±4.2, n = 7), 58.5% (±1.2, n = 6) and 42.7% (±4.5, n = 5) at 50, 100 and 150 mM KCl, respectively. Cumulative number of molecules examined was 1256; the number of molecules examined per condition is shown in the figure. (B) 3D density plots of the diffusion constant versus the α factor (slope of log–log MSD versus time plot) of UvrBC versus salt concentration in the presence of ATP. The coloring is a percentage scale relative to the maximum bin size. N was 49, 48 and 72 in increasing order of salt concentration. See Supplementary Figure S6 for original data with errors and representative kymographs.

