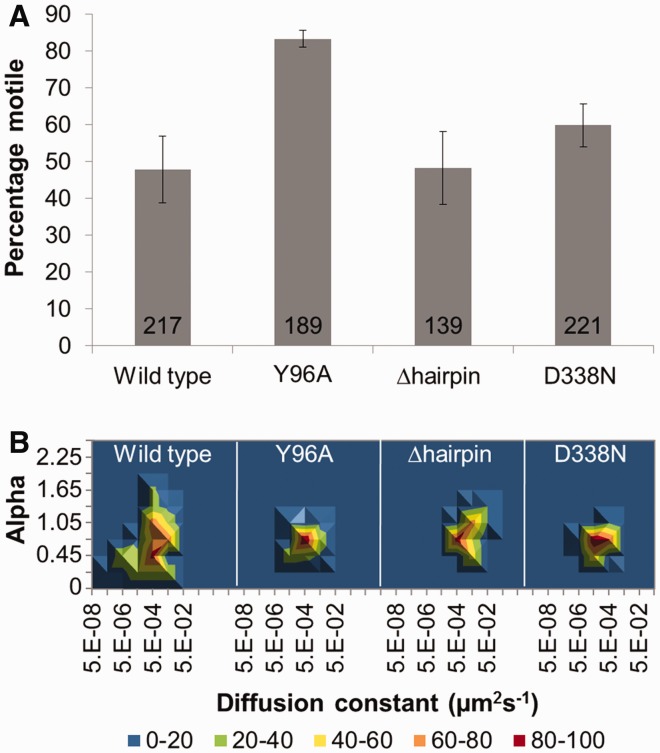
Figure 5.
The effect of UvrB mutation on the motile characteristics of UvrBC at 50 mM KCl and in the presence of ATP. (A) Percentage of moving UvrBC for WT, UvrBY96AC, UvrBΔhairpinC and UvrBD338NC complexes. Mean (±SE, where n refers to experiments repeated on different days) values were 47.9% (±4.8, n = 7), 84.1% (±2.3, n = 4), 48.4% (±9.9, n = 6) and 60.1% (±5.9, n = 3), respectively. (B) 3D density plots of the diffusion constant versus the α factor for each UvrBC mutant complex. The coloring is a percentage scale relative to the maximum bin size. N (in same order as aforementioned) was 49, 61, 41 and 48. See Supplementary Figure S7 for original data with errors and representative kymographs.

