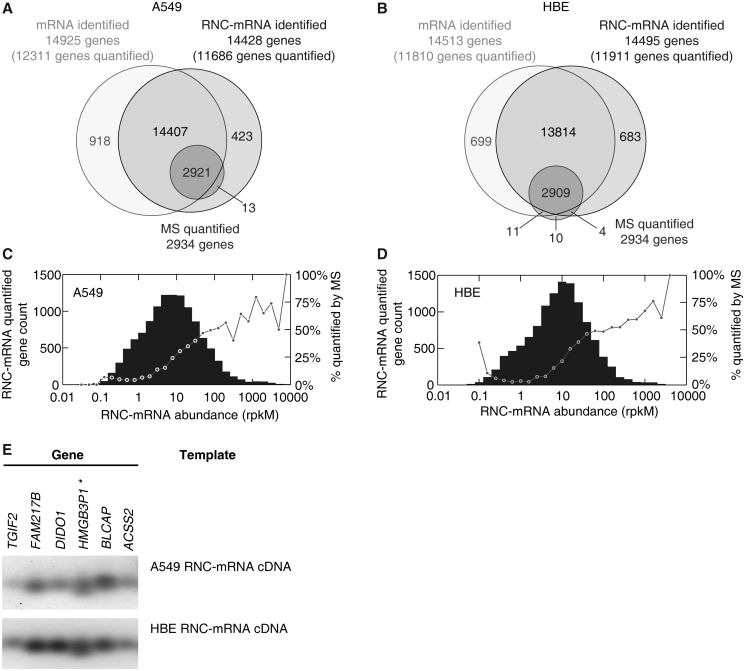
Figure 2.
Gene identification in translatome and transcriptome sequencing, in comparison with SILAC-based mass spectrometry. (A and B) Number of genes and proteins identified with RNA-seq (lighter circles) and MS (dark circle), respectively, in A549 cells (A) and HBE cells (B). (C and D) RNC-mRNA abundance distribution in A549 cells (C) and HBE cells (D). Genes were step-wise classified, based on abundances of quantified RNC-mRNA. Each bar indicates gene number of detection in its respective category. In each category, the percentage of the number of MS quantifiable protein to the number of genes that are detected by RNC-mRNA sequencing is shown with a dot. (E) Validation of gene detection in RNC-mRNA, extracted from A549 and HBE cells, respectively. Six randomly selected genes were subjected to RT-PCR assays and indicated by HGNC gene names.

