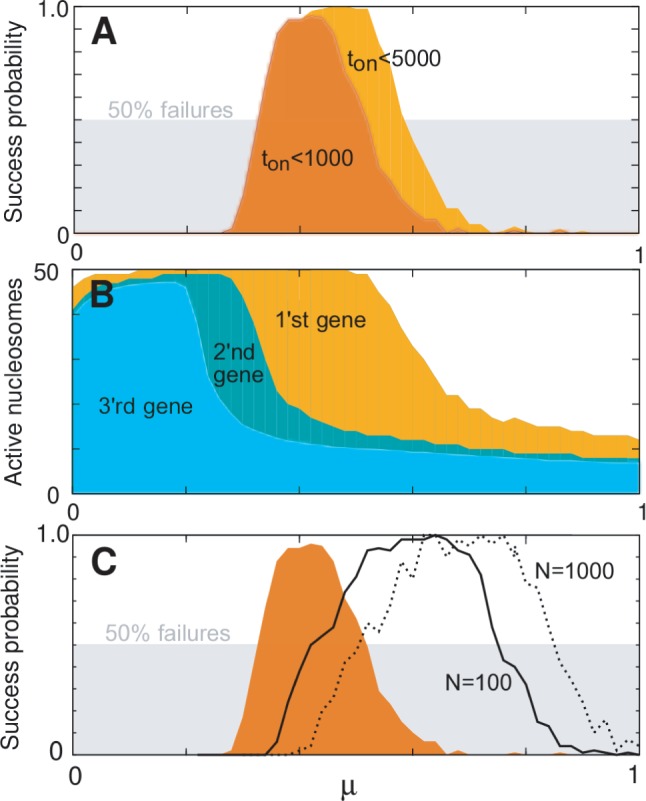
Figure 4.

Model sensitivity to activation bias parameter μ, for  genes, L = 50 nucleosomes system with repression factor r = 1, hill h = 2 and noise
  fixed. Data are averaged over 200 simulations. (A) Orange area shows the probability that one and only one gene becomes active within 5000 time units as function of asymmetry μ. Concurrent dark orange area marks success with the additional constraint that one gene becomes active within the first 1000 time units. Grey area marks the cut-off at 50% successful simulations. (B) Orange area marks the largest number of active nucleosomes within one gene during a 5000 time-unit simulation. When no genes reach full activity during the first 5000 time-units, no ORs have turned on. Cyan and dark cyan show maximal activity of the second and third most active genes, respectively. Where the second most active gene has many active nucleosomes, the two genes have shown simultaneous activity. (C) Orange area as in panel A. The two black curves refer to simulations with the sharper threshold function for gene activity described in ‘Materials and Methods’ section, and gene copy numbers as indicated. Only assigning feedback activity to genes where more than two-third of their nucleosomes are marked as active, even N = 1000 genes can differentiate successfully. Data for black curves are averaged over 50 simulations. See also Supplementary Figure S2 for sensitivity to parameters r, h, and β.
