
Figure 1.
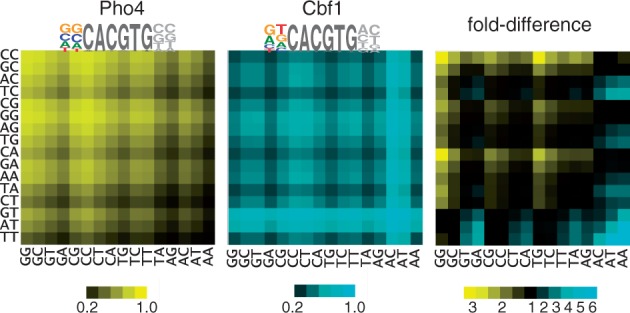
Heatmaps showing relative occupancy by Pho4 and Cbf1 at all 256 variants of the binding site NNCACGTGNN; rows indicate the 5′ dinucleotide, columns the 3′ dinucleotide. Occupancies for Pho4 and Cbf1 (left and center, respectively) are based on the relative free energies of binding for dinucleotides flanking the CACGTG core (8), with the assumed protein concentration adjusted so the mean occupancy among all sites is 0.5. The fold-difference between Pho4 and Cbf1 occupancies is shown in the panel on the right, with motifs having higher occupancy for Pho4 shown in blue and those with higher occupancy for Cbf1 shown in yellow. The sequence logos for Pho4 and Cbf1 are based on a consensus CACGTG core plus flanking base preferences that are derived from a linear regression of the experimentally measured free energy differences for the 16 dinucleotide free energy values (8). The result is a best-fit estimation for the relative contributions to binding of each of the four bases at each of the two positions.