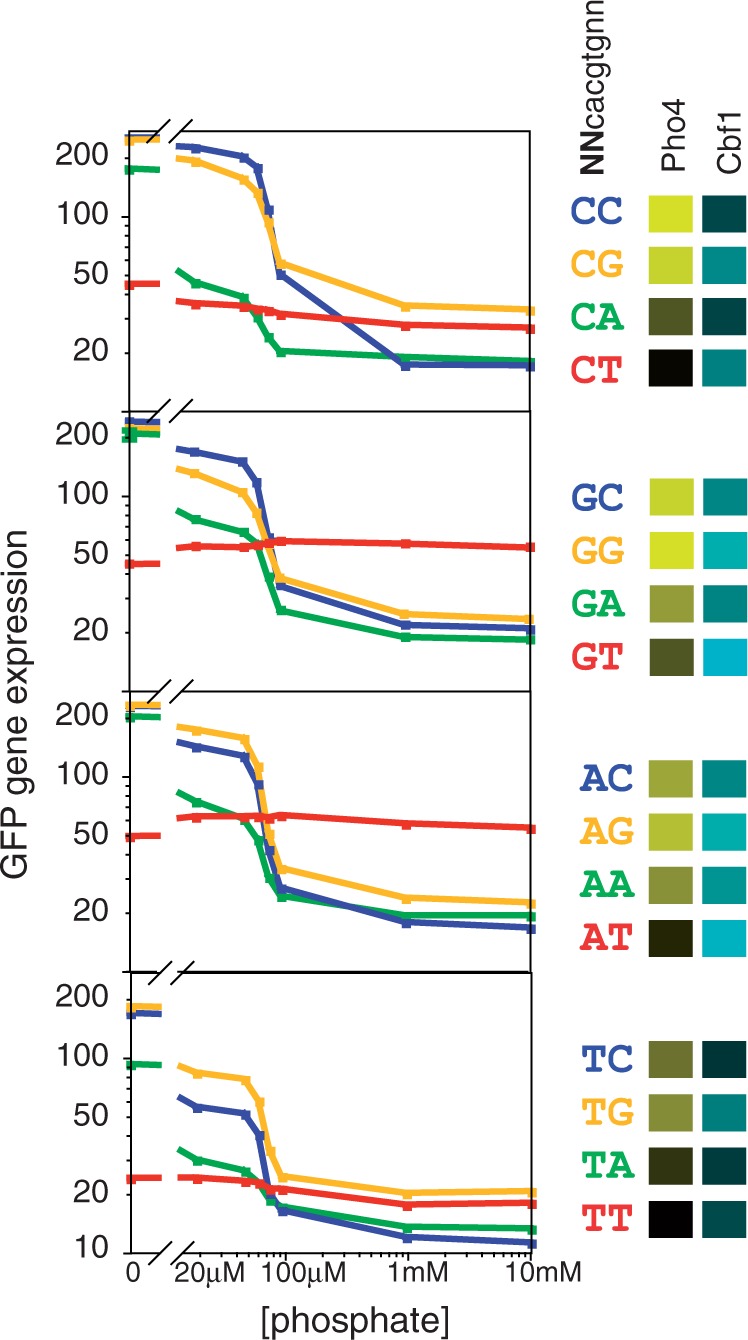
Figure 2.

Phosphate-concentration dependence of gene expression from promoters containing each of the 16 possible palindromic Pho4/Cbf1 motifs (NNCACGTGNN). The four graphs group sites according to the identity of the distal flanking base; for example, the top graph shows expression for the four promoters that contain variants of CNCACGTGNG. Within each graph, the color denotes the base immediately 5′ to the core hexamer; for example, the blue line in each graph indicates a variant of NCCACGTGGN. Also shown in this panel are the relative affinities of the 16 sites for Pho4 and Cbf1, according to the color scheme in Figure 1.
