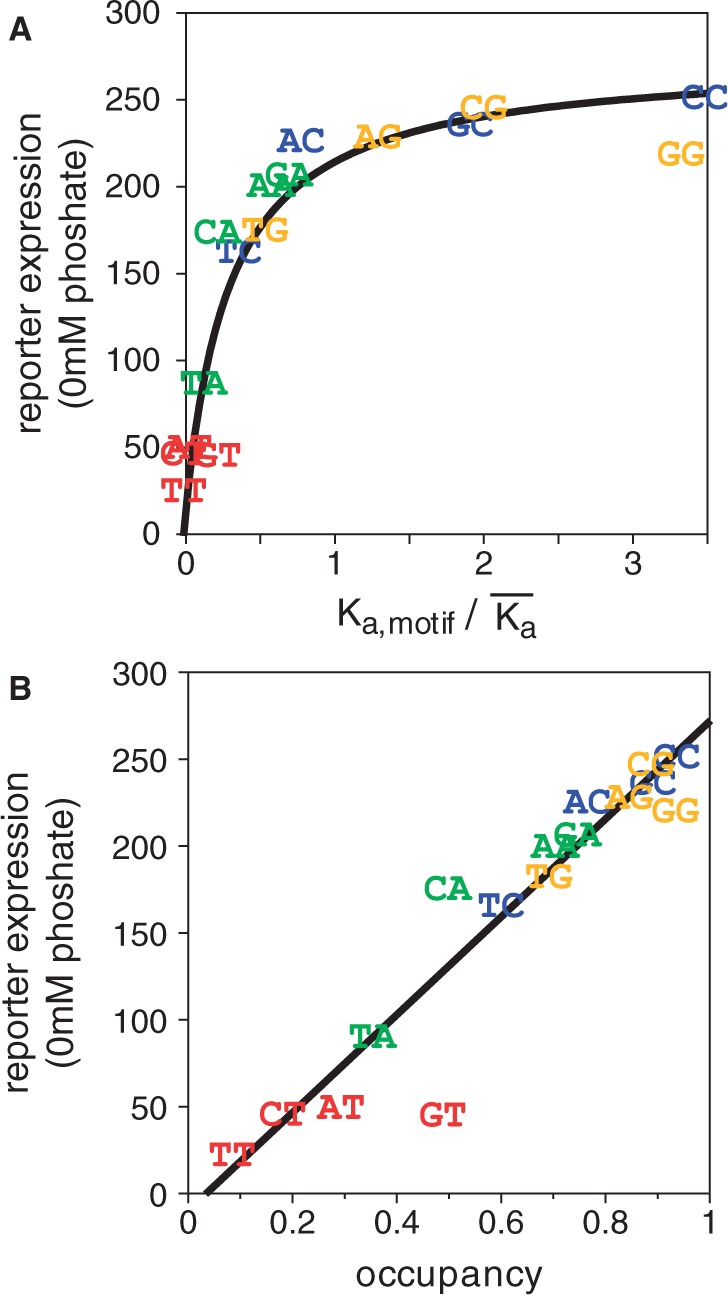
Figure 3.

(A) Reporter expression levels under fully inducing conditions (0 mM phosphate) plotted against relative Pho4 binding affinity. Motifs are indicated by the same two bases used in Figure 2. The data have been fit to a standard binding isotherm, yielding an apparent protein concentration, relative to the mean affinity, of 4 (Methods). (B) Alternative representation of the data in panel A, based on calculating the predicted occupancy of each motif at a protein concentration 4 times the mean Kd. The line is a linear fit of expression versus predicted occupancy.
