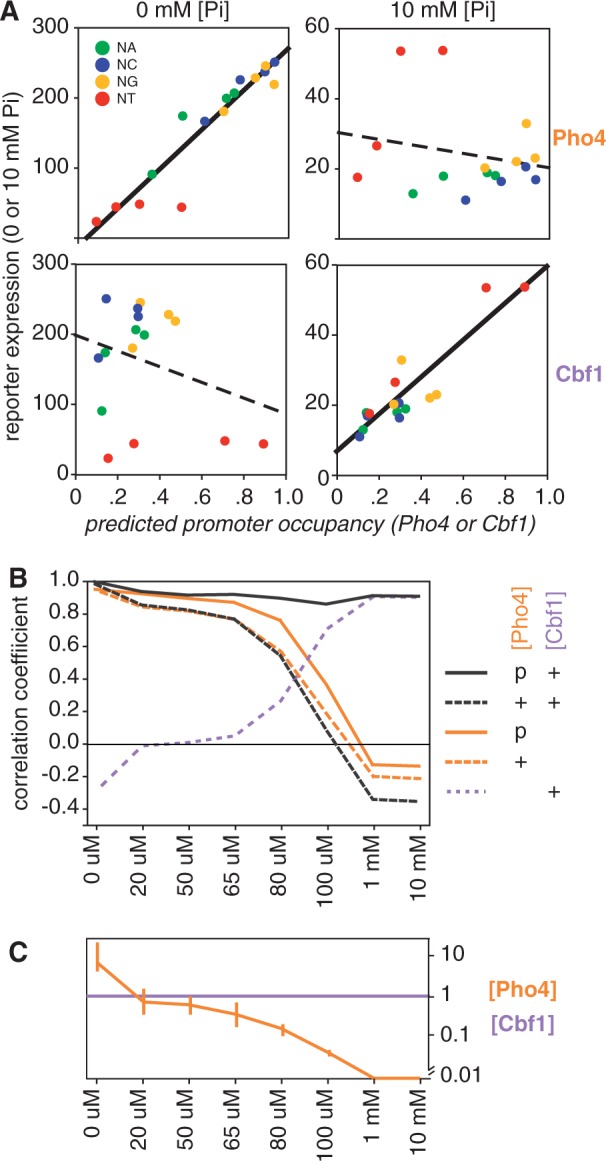
Figure 4.

Expression and predicted binding. (A) Correlation between reporter gene expression at different phosphate concentrations and the predicted occupancy of Pho4 to 16 palindromic binding sites. (A: top left) Expression in 0 mM phosphate, reproducing data in Figure 2C. Solid line indicates a high linear correlation coefficient (R = 0.94). (A: top right) Expression at 10 mM phosphate. The dashed line indicates a weak inverse correlation between expression and Pho4 binding (R = −0.22). (A: bottom two panels) Analogous to the top panels, but using predicted Cbf1 occupancy rather than Pho4; a concentration of 1 was used (equivalent to the mean of the relative Kd’s). Note the strong correlation at 10 mM phosphate and the weak correlation at 0 mM phosphate, opposite to what is observed for Pho4. (B) Changes in correlation coefficient with predicted binding as expression levels change in response to different phosphate concentrations. Expression was predicted using five variations of the model as indicated in the key. ‘+’ Indicates a fixed concentration of [Pho4] = 4, as in panel A and in Figure 2, or a concentration of 1 in the case of Cbf1. ‘p’ indicates the parameterization of [Pho4], optimizing the fit at each phosphate concentration. (C) The transcription factor concentrations used at each phosphate concentration to obtain the best fit between predicted and observed expression (solid black line in panel B). The error bars on the Pho4 concentration line represent the range of concentrations that produce correlation coefficients within 0.015 of the optimal value shown in panel B (See Methods).
