
Figure 6.
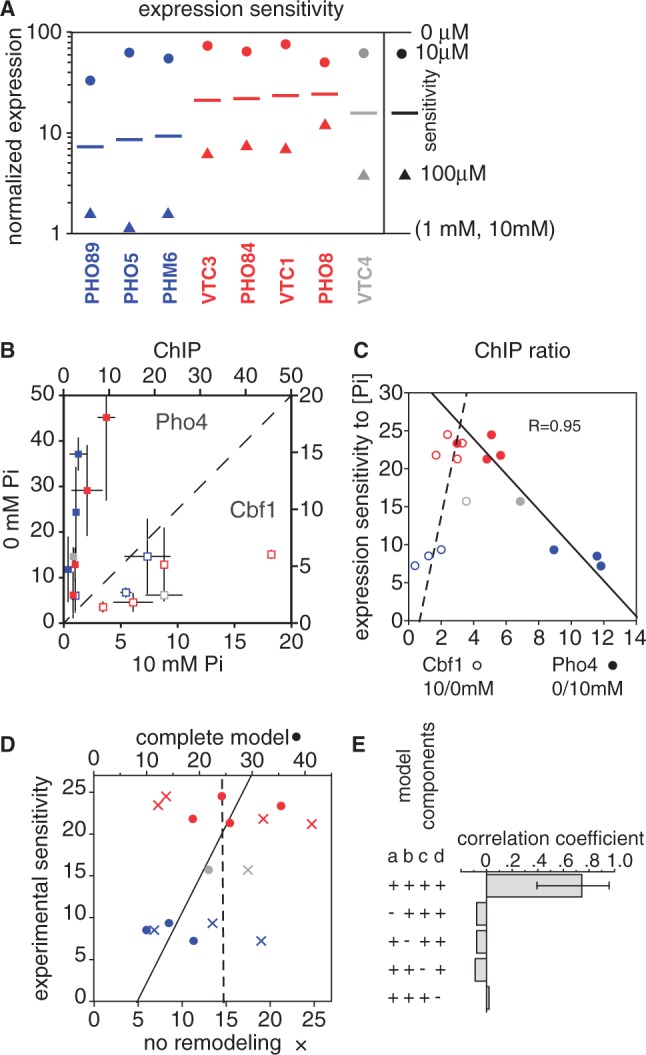
Sensitivity of natural promoters to intermediate phosphate concentrations is related to Cbf1 affinity. (A) Normalized gene expression levels at different phosphate concentrations. Expression was determined by microarray analysis at 0 μM, 10 μM, 100 μM, 1 mM and 10 mM [Pi], and was normalized between a value of 1 (average for 1 and 10 mM, as these were similarly low) and 100 (0 μM). As indicated in the legend, the colored circles represent the expression level in 10 μM phosphate, while triangles shows expression in 100 μM phosphate. The line midway between the two is the log-average of these values; we use this value as a measure of the sensitivity of a gene to intermediate phosphate. Blue and red genes are the same as those classified by Kim and O’Shea (25) as having low and high thresholds for induction, and are colored in the same way. [Some gene names are different, reflecting changes in the nomenclature used in the Saccharomyces Genome Database (SGD) (20)]. VTC4 (gray) has been included in this analysis, as its promoter was the basis for the reporter experiments described here. (B) ChIP of Pho4 (closed squares) and Cbf1 (open squares) in high and low phosphate. Values and error bars are the average and standard error of enrichment values for two sets of experiments using Myc-tagged and HA-tagged proteins (Methods). Colors are as in panel A. (C) Correlation of induction sensitivity with the change in transcription factor binding. The fold-difference in ChIP enrichment values are shown for both for Pho4 (closed squares; 0/10 mM phosphate) and Cbf1 (open squares; 10/0 mM). Note that the Pho4 and Cbf1 ChIP enrichment ratios can be compared for a given gene because the two values share the same y-axis values. (D) Correlation between the experimentally determined phosphate sensitivity of expression and two in silico predictions. One (X’s) is the model used for the reporter constructs in Figure 4, which takes into account competition between Cbf1 and Pho4 and ascribes a low level of transcriptional activity to bound Cbf1. The second model (circles) includes the same terms, but also models chromatin changes as reported for the reporter gene sensitivity values in Figure 5. The dashed and solid lines indicate fits to these predictions, respectively. The parameters used, and an analysis of the sensitivity to those parameters, are shown in Supplementary Figure S11. (E) Correlation coefficients for the chromatin remodeling model shown in panel D, along with the effect of leaving out certain terms. The error bars for the top histogram bar indicates the 95% confidence interval for the correlation as defined by bootstrap resampling. Leaving out any term that is required for modeling the cooperative effects of Cbf1 chromatin remodeling results in an insignificant correlation. The terms are labeled a–d: (a) are there two states for the promoter, ‘open’ and ‘closed’?; (b) is there tighter binding of Pho4 and Cbf1 to the ‘open’ state?; (c) does Cbf1 binding shift the equilibrium toward the open state?; (d) is Cbf1 included in the model at all?