
Figure 2. Kinetics of H2O2 generation by native microsomes.
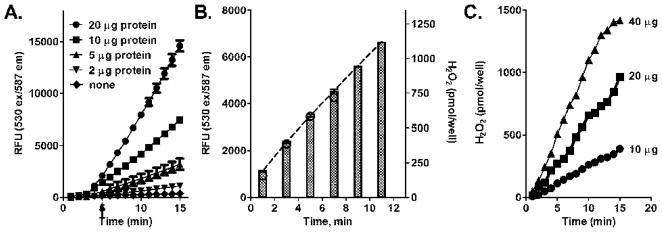
Panels A and C. Continuous recordings of H2O2 generation by rat and human liver microsomes. Each well on a 96 well plate was loaded with 90 μl of incubation media containing: potassium phosphate buffer, 50 mM, pH 7.7, 1 mM DETAPAC, 1 mM azide, 500 Units/ml SOD, 0.1 mM NADPH, and an NADPH regenerating system, (10.0 mM glucose-6-phosphate and 0.5 Units/ml glucose-6- phosphate dehydrogenase). The plate was preincubated at 37°C for 5 min in the plate reader chamber. The wells were then loaded with 50 μl of AR/HRP. The reactions were started by the addition of 10 μl microsomal preparations using a multichannel pipette (as indicated by arrow). The lines represent time-dependent changes of fluorescence generated with different amounts of microsomal protein (as indicated). The data for rats are the mean ± SD of two experiments and humans, are the mean ± SD of three experiments. Each microsomal protein concentration was done in triplicate. Panel B. H2O2 generation by rat liver microsomes assayed at fixed time points. Mixes were prepared as indicated above; reactions were initiated by the addition of 10 μg of microsomal protein. In this mode of assay, the 50 μl of AR/HRP mixture were added to the wells at the indicated time points. The bars reflect the fluorescence intensity recorded at those time points. The dashed line connecting the top of the bars was generated by GraphPad Prism and used for calculating the absolute rates of H2O2 production.