
Figure 4. Kinetics of H2O2 generation by recombinant recombinant human NADPH-cytochrome P450 reductase.
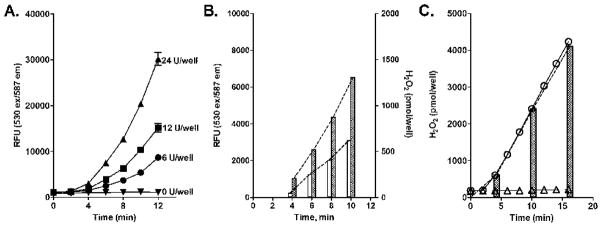
Assay mixes were prepared as described in the legend to Figure 3. Panel A. Continuous recording of H2O2 generation. The amounts of microsomal protein are indicated as Units of NADPH-cytochrome P450 reductase activity in cytochrome c reduction. The data are the mean ± SD of four experiments with each microsomal protein concentration analyzed in duplicate. Panel B. H2O2 generation by human NADPH-cytochrome P450 reductase assayed at fixed time points. The amounts of microsomal protein added were: open bars - 6 Units of NADPH-cytochrome P450 reductase/well; dotted bars - 12 Units of NADPH-cytochrome P450 reductase/well. The data are the mean ± SD of four separate experiments performed in duplicate. The dashed lines connected tops of the bars were generated by GraphPad Prism and used for calculation of absolute rates of H2O2 production. Panel C. Assay of H2O2 generation in the presence of 50 μM paraquat in continuous (circles) and fixed time points mode (black bars) assays. The amounts of microsomal protein added to the wells were 0.2 Units of NADPH-cytochrome P450 reductase/well. Bottom line (triangle) indicates the level of background fluorescence in wells with no proteins added. The data are the mean ± SD of two separate experiments performed in triplicate.