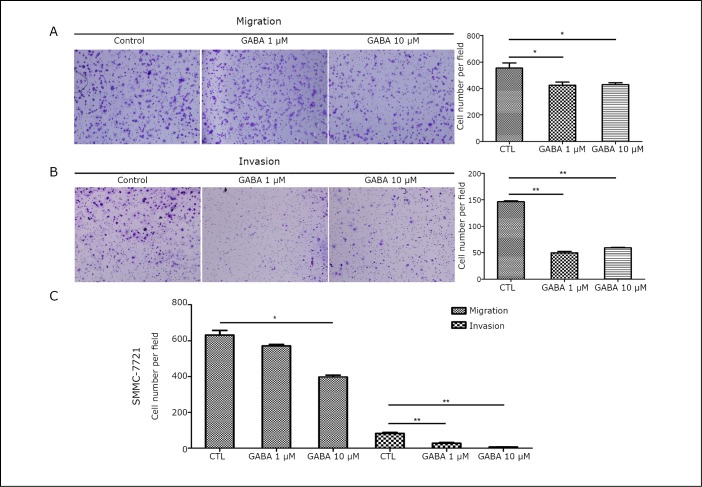
Figure 2.
GABA-inhibited HCC migration and invasion. A, B: Migration and invasion assays were performed in SK-Hep1 cells stimulated with various concentrations of GABA (1 µM and 10 µM) for 24 h. Representative images are shown on the left, and the quantification of 5 randomly selected fields is shown on the right. C: Migration and invasion assays were performed in SMMC-7721 cells stimulated with GABA for 24 h. Data are representative of 3 independent experiments and are shown as means ± SEM. (*, P<0.05, **, P<0.01, by one-way ANOVA analysis).

