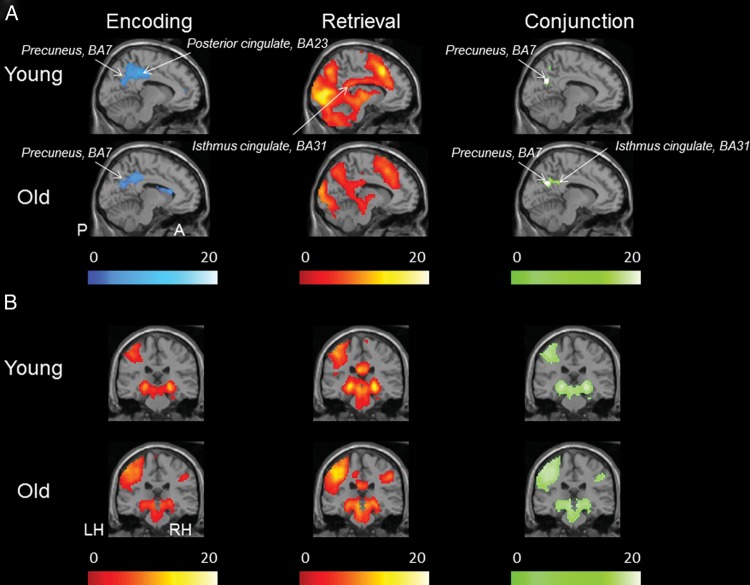
Figure 1.
Brain regions involved in the memory encoding and retrieval fMRI task. (A) One sample t-test statistical parametric map (random effects) showing deactivation during encoding and activation during retrieval as well as the conjunction for these 2 statistical maps in young and older adults, demonstrating a significant E/R flip in the PMC. Lighter color scale indicates more significant activation (yellow/red), deactivation (blue), or conjunction (green). (B) Activation in encoding and activation during CR as well as the conjunction for these 2 statistical maps, demonstrating a significant overlap in the hippocampus region. The functional maps are thresholded at P< 0.001, minimal extent threshold 5 adjacent voxels and superimposed on a single subject T1 image (X = −9 in the sagittal view and Y = −27 in the coronal view).

