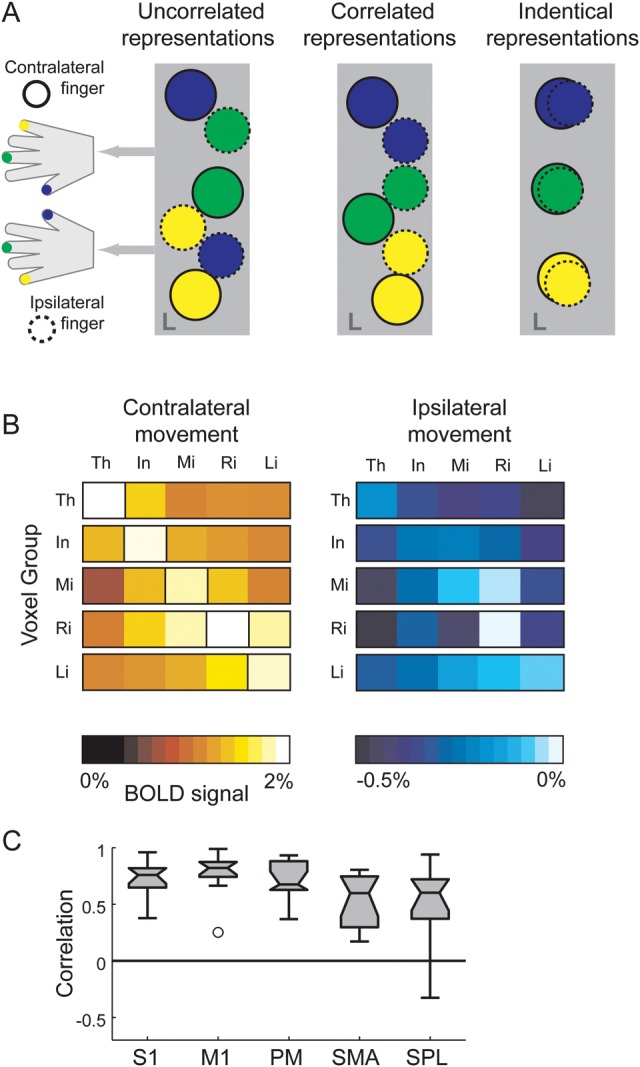
Figure 3.

Similarity analysis between ipsilateral and contralateral finger representations. (A) Three hypothetical arrangements of finger patches: small regions of cortex that are preferentially activated for one of the contralateral (solid circles) or ipsilateral (dashed circles) fingers. Note that activation patches for individual fingers in M1 are highly overlapping; the distinct patches are for illustration only. Uncorrelated representations: patches for ipsi- and contralateral fingers are distinct and arranged in an interdigitated but uncorrelated fashion. Correlated representations: distinct patches, although patches responding to ipsilateral finger movements are always near patches responding to the corresponding contralateral fingers. Identical representations: ipsilateral movements activate the same patches as the corresponding contralateral finger. The latter 2 architectures would lead to a high spatial correlation of ipsilateral and contralateral patterns. (B) Percent signal change in the hand area of primary motor (averaged over hemispheres and individuals) for contra- and ipsilateral finger presses. Data are split into 5 groups of voxels according to the contralateral finger for which the voxels showed the maximal activation (left, highlighted diagonal in matrix). For ipsilateral actions (right), voxel groups tend to show the highest activation, below a global suppression, for movements of the mirror-symmetric ipsilateral finger. (C) Voxel-by-voxel correlation between the contralateral and ipsilateral finger patterns, corrected for overall noise and common activation patterns. The box plot extends from the 25th to the 75th percentile. Whiskers indicate the full range of the data. Outliers (indicated by circles) are data points that are more than 1.5 times the box length away from the median.
