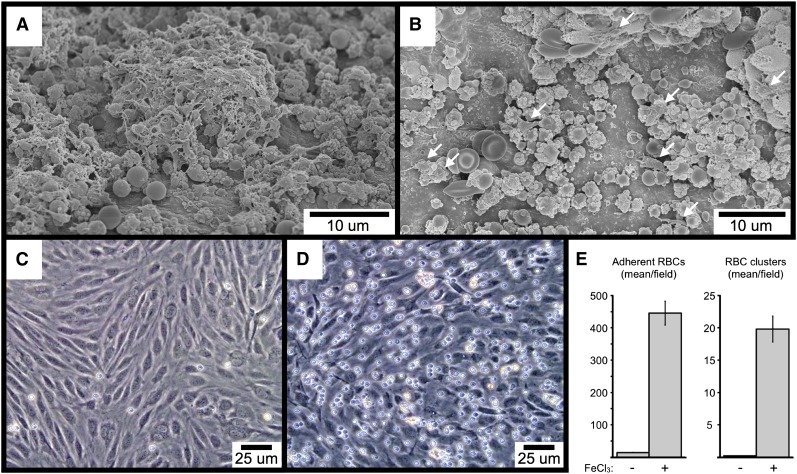
Figure 7.
SEM visualization of carotid artery FeCl3-induced thrombosis in VWF-deficient (A), and GPIb-α extracellular domain–deficient mice (B). The few platelets in (B) are indicated with arrows. The time course is 4 minutes after FeCl3 application for both samples (A-B). (C-E) The images demonstrate FeCl3-induced adhesion of washed human RBCs to cultured HUVECs under flow. (C) shows the buffer-only control, and (D) the buffer plus FeCl3.. The graph in (E) shows the quantitation of adherent RBCs and RBC clusters from 4 independent experiments, with a minimum of 5 random ×20 fields per experiment. Three or more RBCs together were considered a cluster. The error bars represent the standard error of the mean.

