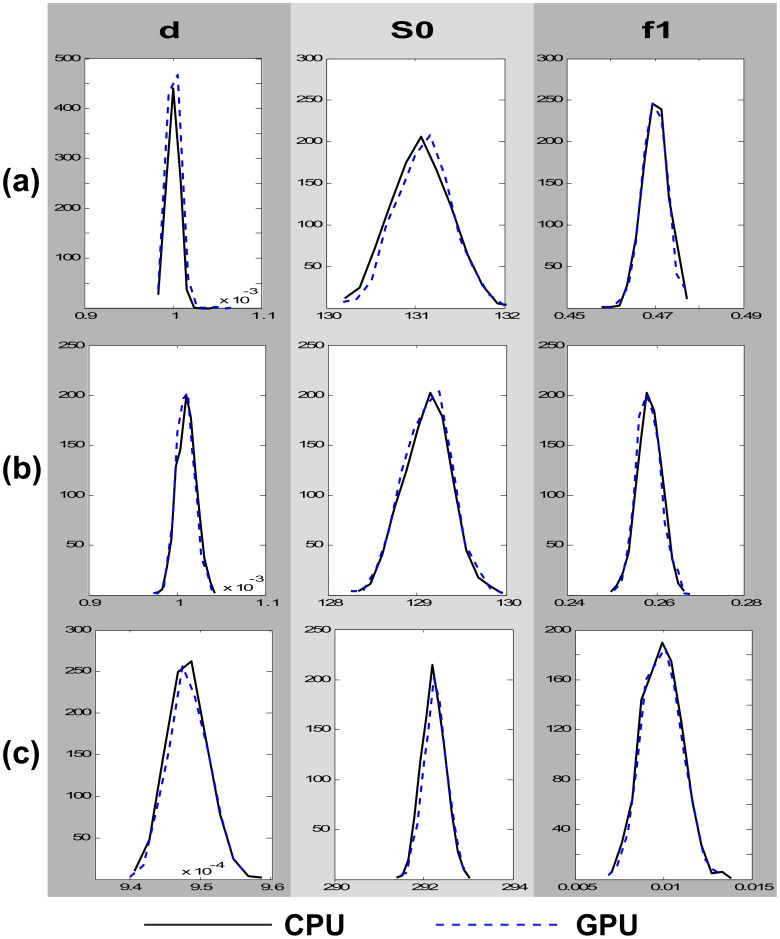
Figure 7. Comparison between CPU and GPU model estimates for the diffusivity d, the baseline signal  and the volume fraction of the first fibre
  , in different brain areas.
(a) A corpus callosum voxel, (b) a centrum semiovale voxel and (c) a grey matter voxel. Each design was ran 1000 times on the same data and for each repeat the mean of the posterior distribution of the respective parameter was recorded. The histograms show the distributions of these means across all 1000 repeats. For each repeat, a burn-in period of 3000 iterations and a thinning period of 25 samples was used for the MCMC.

