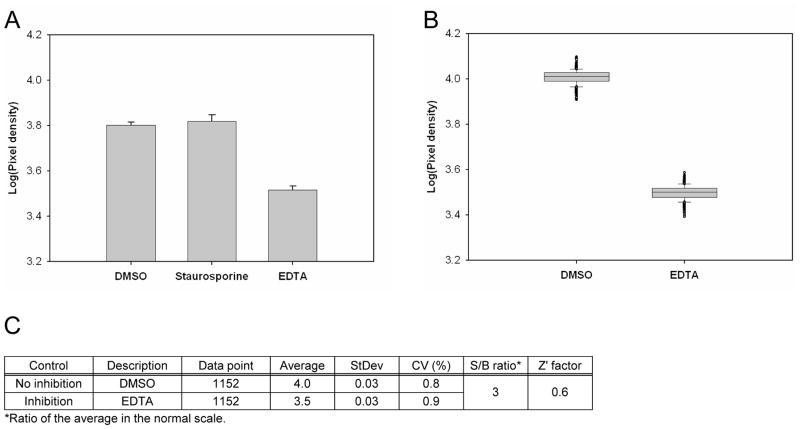
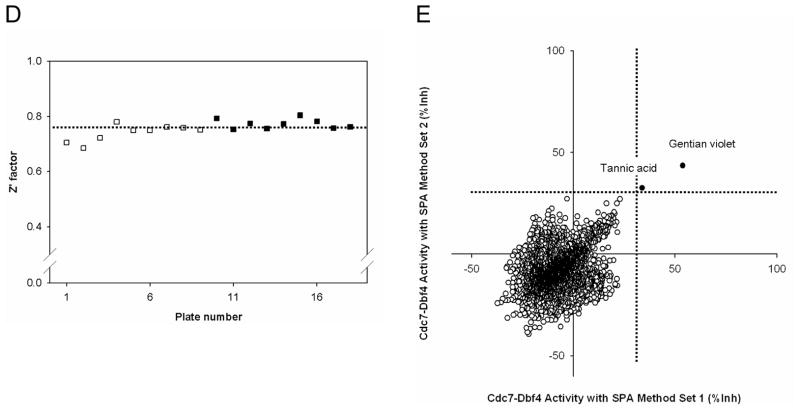
Figure 1. Pilot screen by the Cdc7-Dbf4 kinase assay with the SPA method.
(A). Control selection. 5 ng of Cdc7-Dbf4 heterodimer were incubated in a volume of 10 μL for 2 hr at room temperature with 25 μM [γ-33P]-ATP (5 μCi/nmol) in the presence of 1% DMSO (v/v), 10 μM Staurosporine in 1% DMSO (v/v), or 45 mM EDTA in 1% DMSO (v/v) in a 384-well microtiter plate. HIS TAG PS Imaging beads were dispensed, and the plate was sealed and incubated for 1 hr. After a centrifugation for 30 sec at 3,000 rpm, the radiometric signal was detected with the LEADseeker. The results are the average ± standard error (Avg ± SE) of 10 data points (n=10). (B). Control assessment. Three 384-well micro-titer plates contained 1% DMSO (v/v) as the “no inhibition” control and three 384-well micro-titer plates contained 45 mM EDTA in 1% DMSO (v/v) as the “inhibition” control. The radiometric signal of 1,152 data points is presented as a box plot. (C). Statistics of the no inhibition control and the inhibition control with 1,152 data points. (D). Pilot screen of a collection of 2,879 compounds. Screen was conducted in duplicate, with 18 assay plates. Chart of the Z′ factor of each assay plate is presented. The Z′ factor was calculated with the average and standard deviation of the radiometric signal of 16 wells of the no inhibition control and the inhibition control. The results of 9 assay plates of Set 1 (□) and 9 assay plates of Set 2 (■) are shown. Dotted line shows the average of the Z′ factor of the 18 assay plates (0.76). (E). Scatter plot analysis of the pilot screen data correlating the percent inhibition of the duplicate data. X- and Y-axis shows the percent inhibition of each compound in Set 1 and 2, respectively. Tannic acid and Gentian violet showed the inhibition of higher than 30% (dotted lines) in both data sets and were selected as positives (●).


