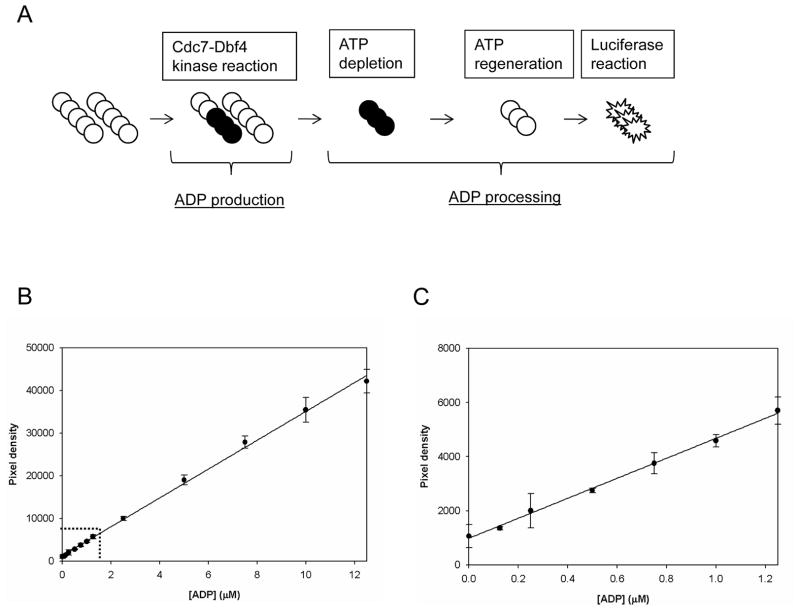
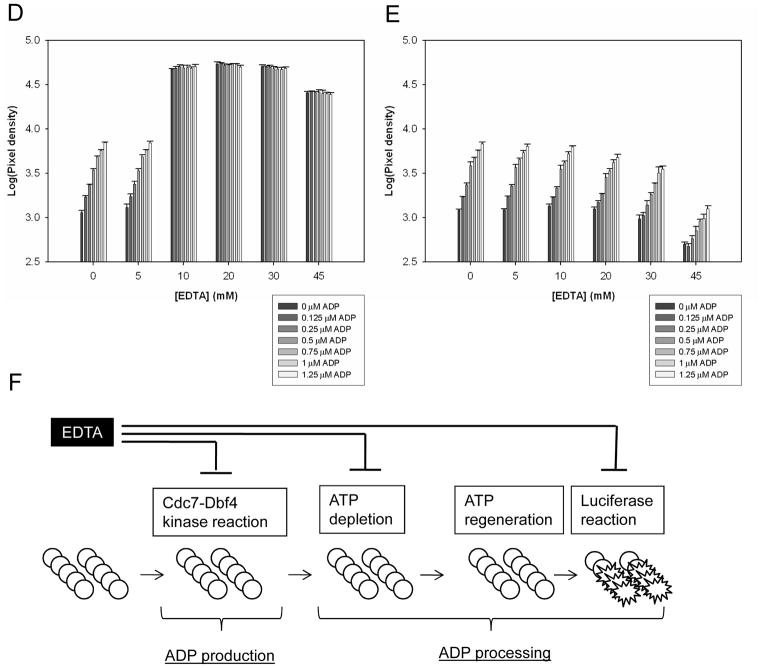
Figure 2. Evaluation of ADP processing step of the LUM method.
(A). Scheme of the LUM method to detect ADP produced in Cdc7-Dbf4 kinase reaction. This assay consists of a two step process: ADP production and ADP processing. In ADP production, ATP (○) is incubated with Cdc7-Dbf4 heterodimer (Cdc7-Dbf4 kinase reaction) and hydrolyzed to ADP (●) and inorganic phosphate (not shown). ADP processing consists of the following 3 steps: ATP depletion, the depletion of the remaining ATP; ATP regeneration, the conversion of the nascent ADP to ATP; luciferase reaction, ATP-dependent monooxygenation of luciferin by luciferase. ATP depletion is conducted by incubation with ADP-Glo Reagent, and ATP regeneration and luciferase reaction are conducted in a single step by incubation with Kinase Detection Reagent. The luminescence signal is proportional to ADP produced in the Cdc7-Dbf4 kinase reaction. (B). ADP standard curve. 12 mixtures of ADP and ATP with a total nucleotide concentration of 12.5 μM and ADP of the indicated concentration were prepared. Each mixture was incubated with ADP-Glo Reagent and Kinase Detection Reagent, and the luminescence signal was detected with the LEADseeker. The results are the Avg ± SE of 14 data points (n=14), and curve of the average was fitted by the single 3-parameter equation of SigmaPlot. (C). Magnified results in the range of 0–1.25 μM ADP indicated with dotted lines in Panel (B). (D). EDTA effects on ADP processing. 42 ADP/ATP/EDTA mixtures of a total nucleotide concentration of 12.5 μM with 7 ADP concentrations and 6 EDTA concentrations were dispensed in a volume of 6 μL in a 384-well micro-titer plate. After incubation with 6 μL of ADP-Glo Reagent, 3 μL of the dialysis buffer and 15 μL of Kinase Detection Reagent were dispensed, and after an incubation, the luminescence signal was detected with the LEADseeker. The results are the Avg ± SE of 4 data points (n=4). (E). EDTA effects on ATP regeneration and luciferase reaction. 6 μL of the 7 ADP/ATP mixtures with a total nucleotide concentration of 12.5 μM were incubated with 6 μL of ADP-Glo Reagent, and received 3 μL of the 6 EDTA dilutions of 0, 10, 20, 40, 60 and 90 mM in matrix. The mixtures were incubated with 15 μL of Kinase Detection Reagent for ATP regeneration and luciferase reaction and the luminescence signal was detected with the LEADseeker. The results are the Avg ± SE of 4 data points (n=4). Note that X-axis corresponds to the x-axis of the graph in panel (D) and does not show the final concentration in the reaction mixtures for ATP depletion and luciferase reaction. See Materials and Methods for details. (F). Scheme of the EDTA effects on ADP production and ADP processing. EDTA at 45 mM in the Cdc7-Dbf4 kinase reaction inhibits ADP production, ATP depletion, and luciferase reaction. See text for details.


