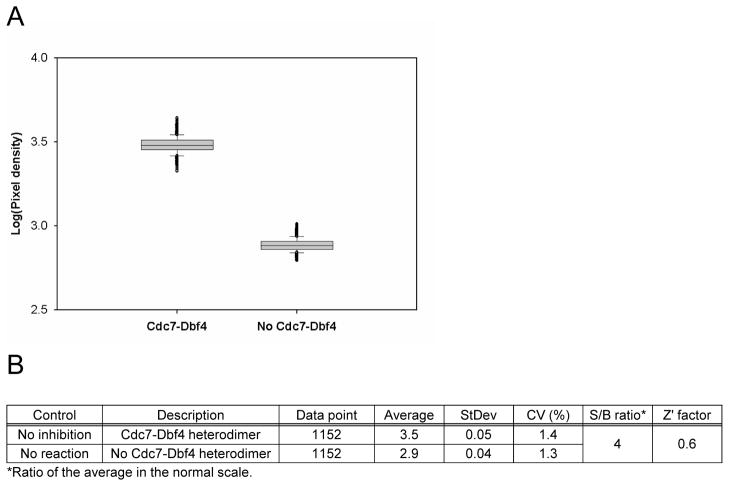
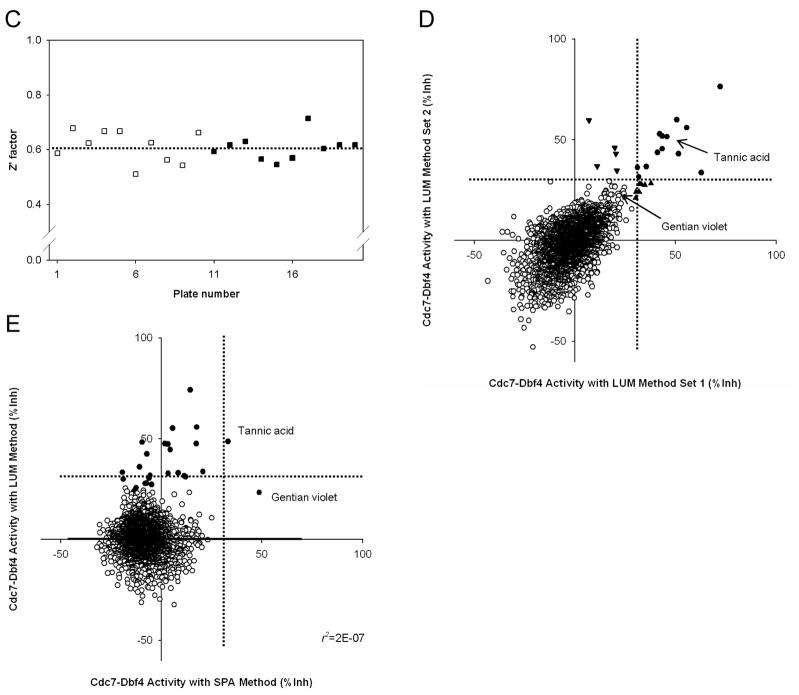
Figure 3. Pilot screen by Cdc7-Dbf4 kinase assay with the LUM method.
(A). Control assessment. Three 384-well plates contained 1% DMSO (v/v) and 5 ng Cdc7-Dbf4 heterodimer as the “no inhibition” control, and three 384-well plates contained 1% DMSO (v/v) and the dialysis buffer that did not contain Cdc7-Dbf4 heterodimer as the “no reaction” control. The luminescence signal of 1,152 data points is presented as a box plot. (B). Statistics of the no inhibition control and the no reaction control with 1,152 data points. (C). Pilot screen of a collection of 3,519 compounds. Screen was conducted in duplicate, with 20 assay plates. The Z′ factor of each assay plate is presented. The Z′ factor was calculated with the average and standard deviation of pixel density of the luminescence signal of 16 wells of the no inhibition control and the no reaction control. The results of 10 assay plates of Set 1 (□) and 10 assay plates of Set 2 (■) are shown. Dotted line shows the average of the Z′ factor of the 20 assay plates (0.61). (D). Scatter plot analysis of the pilot screen data correlating the percent inhibition of the duplicate data. X- and Y-axis shows the percent inhibition of each compound in Set 1 and 2, respectively. A total of 25 compounds that showed the percent inhibition of higher than 30% threshold (dotted lines) in either both Set 1 and Set 2 (●), in Set 1 (▲), or in Set 2 (▼) were selected as the positives. Tannic acid and Gentian violet, the two positives in the previous screen with the SPA method (Figure 1E), are indicated with arrows. Tannic acid showed 46% and 52% inhibition in Set 1 and Set 2, respectively. Gentian violet showed 23% inhibition in both sets. (E). Scatter plot of the averaged percent inhibition of 2,879 compounds between the SPA method and the LUM method. The average of the duplicate data in each method is shown. Black circles (●) indicate the 25 positives of the LUM method (Panel D) and the 2 positives of the SPA method, Tannic acid and Gentian violet (Figure 1D). Gentian violet was positive only in the SPA method, and Tannic acid was positive in both methods. Note that some of the positives in the LUM method showed higher than 30% inhibition in one of the two data sets (▲ and ▼ in Panel D) and the averages of some of such compounds are lower than 30%. There is no correlation between the 2 methods (r2=2E-7).


